Michael Covel’s trend following strategy is for many instruments (futures, ETFs & LEAPs options) and for many markets — currencies, FX, forex, crypto, interest rates, global stock indices, tech stocks, grains, softs, meats, metals and energies. This strategy is not limited to America. Michael’s clients are in 75+ countries, i.e. Singapore to China to Brazil to Japan to Switzerland, etc. His strategy has universal applicability because humans always act the same with money on the line. How can trend following be applied to so many markets? If you think like this graphic the name of the market is irrelevant to trade it:

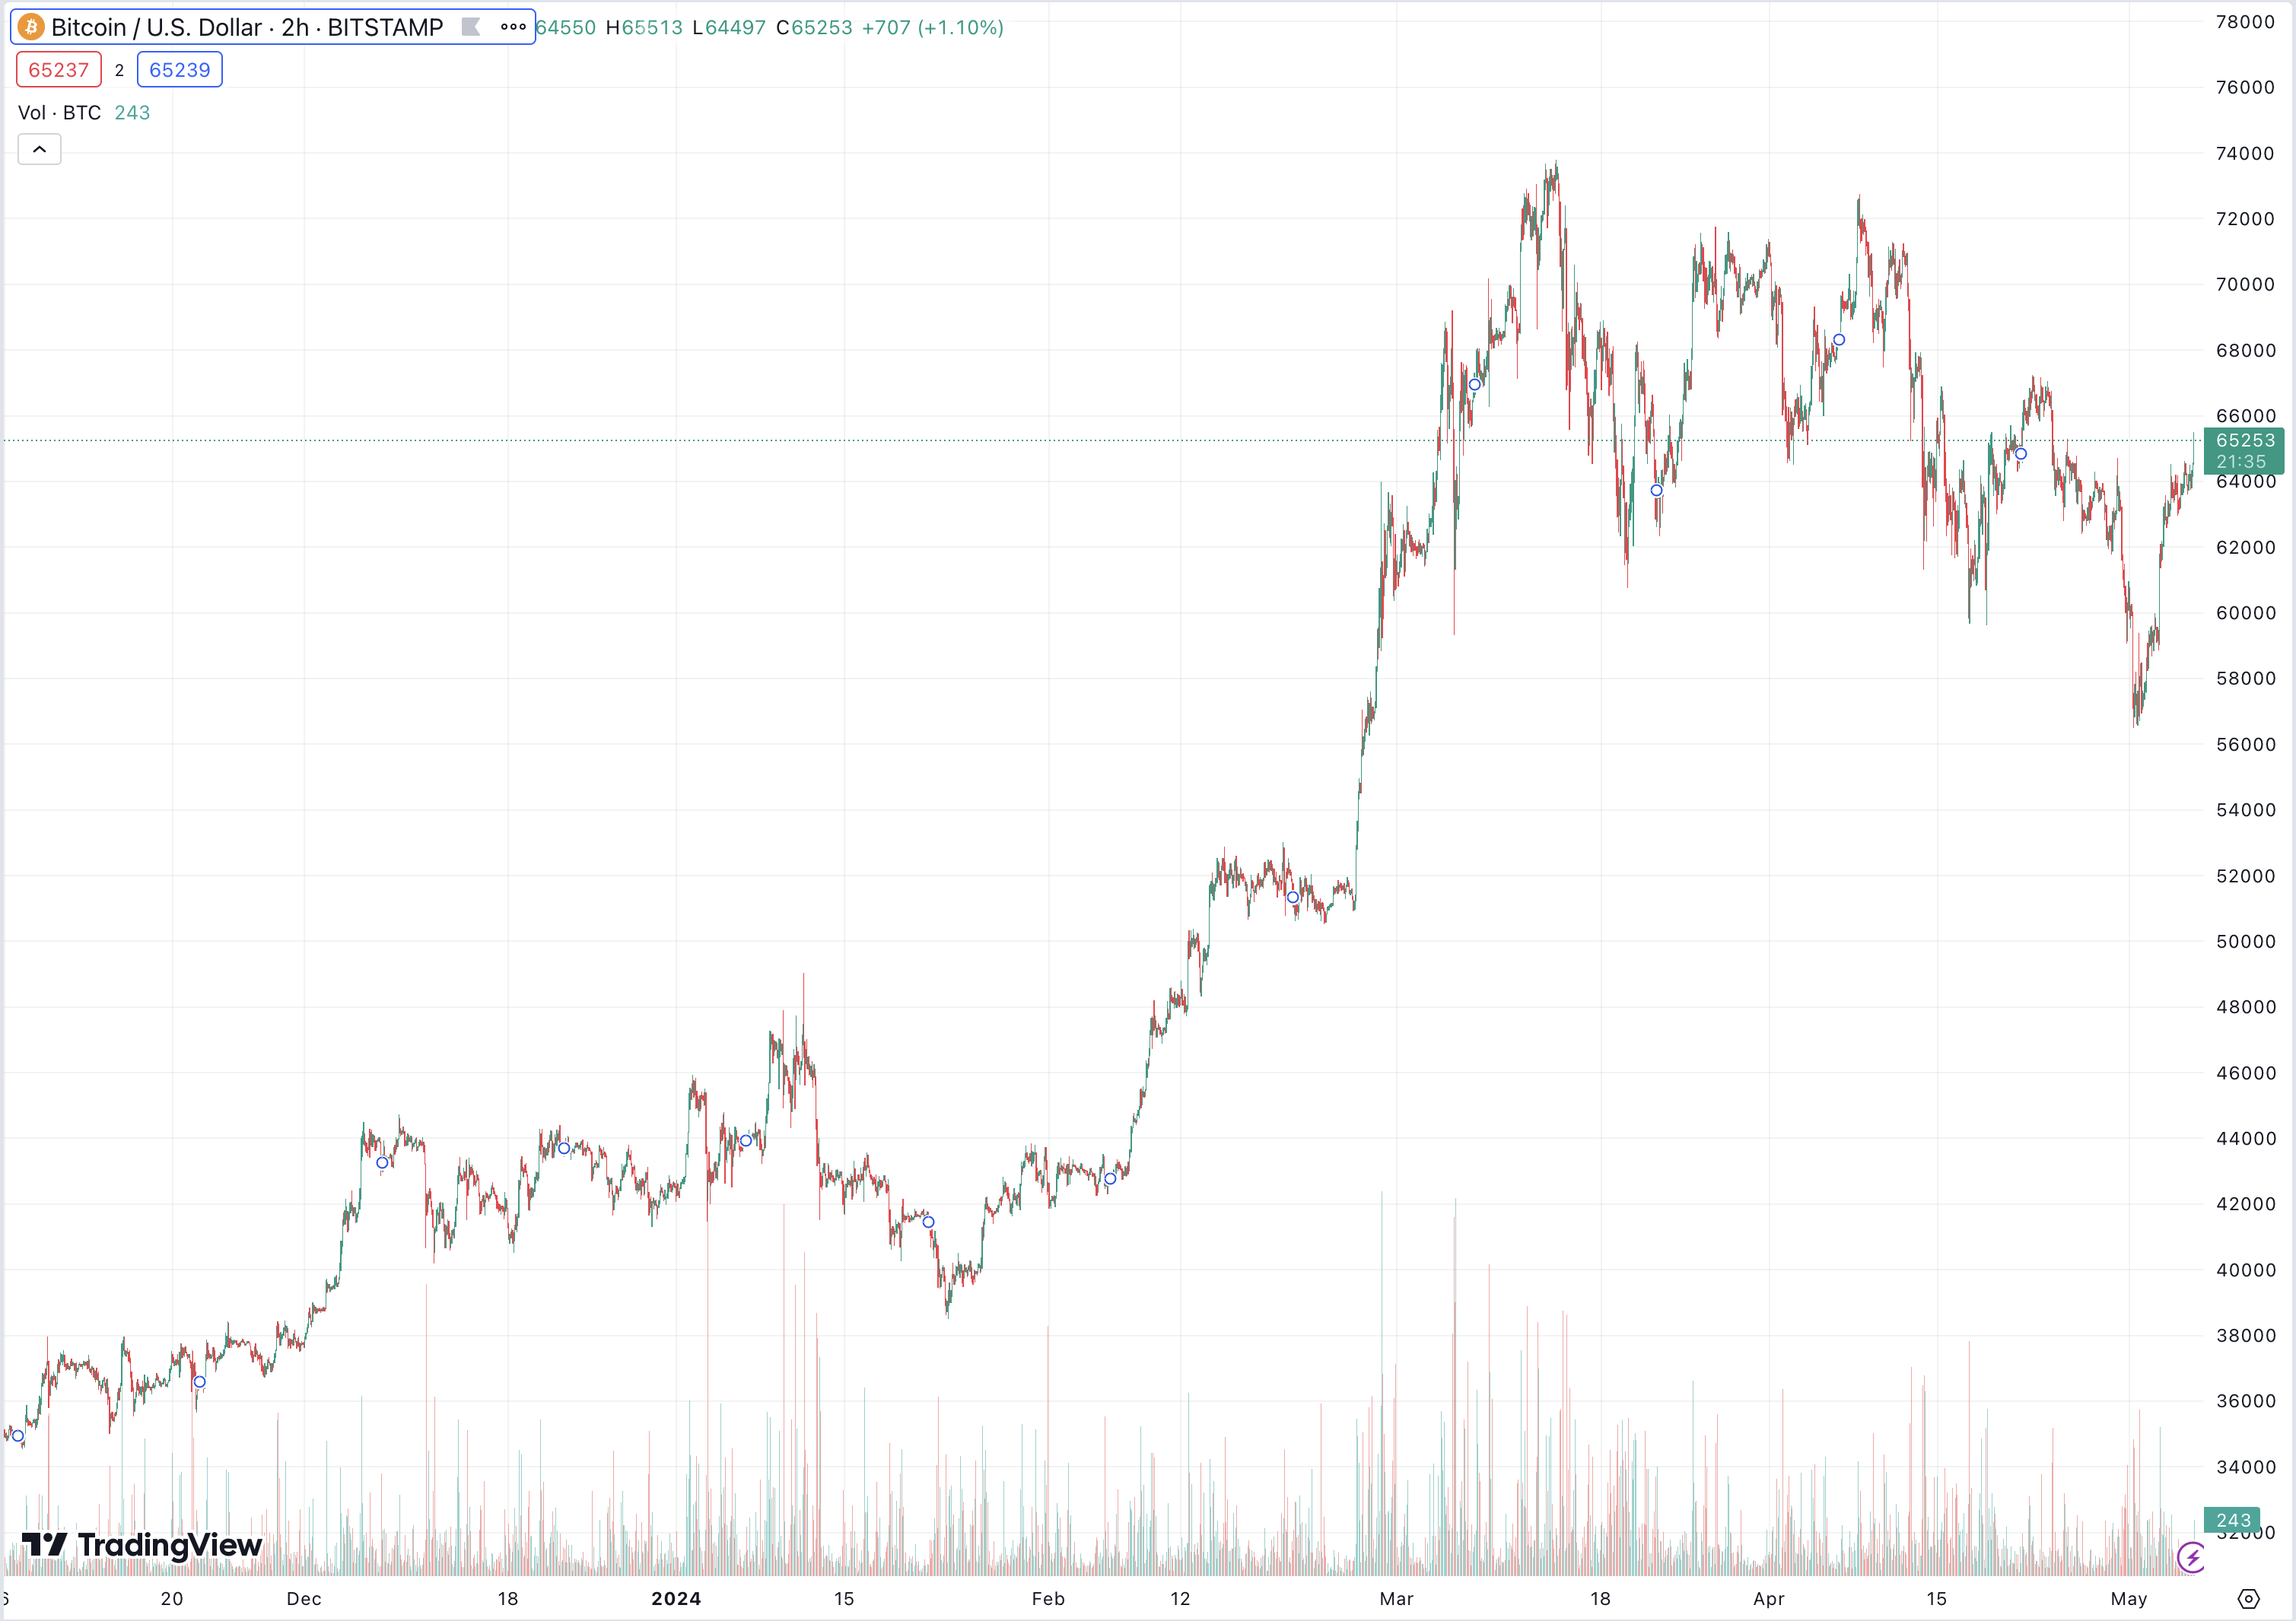
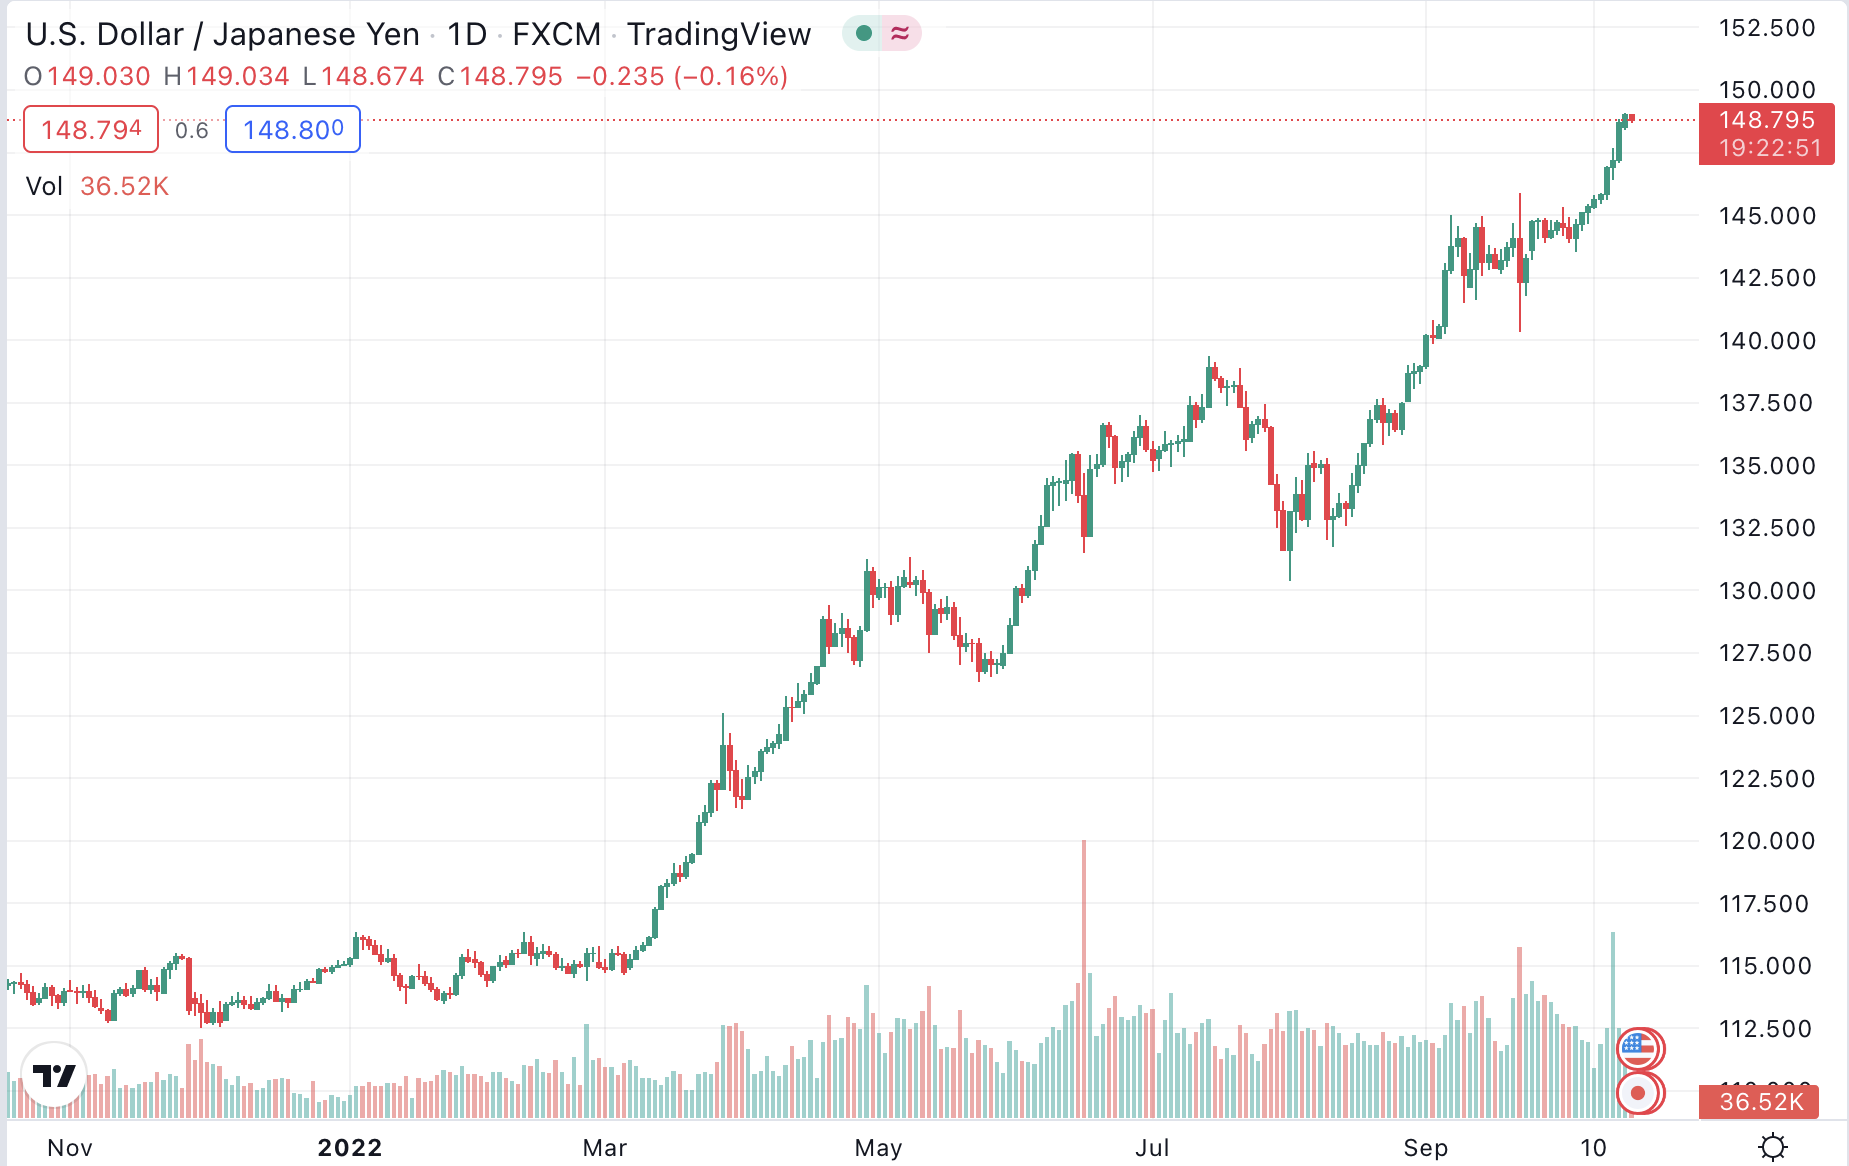
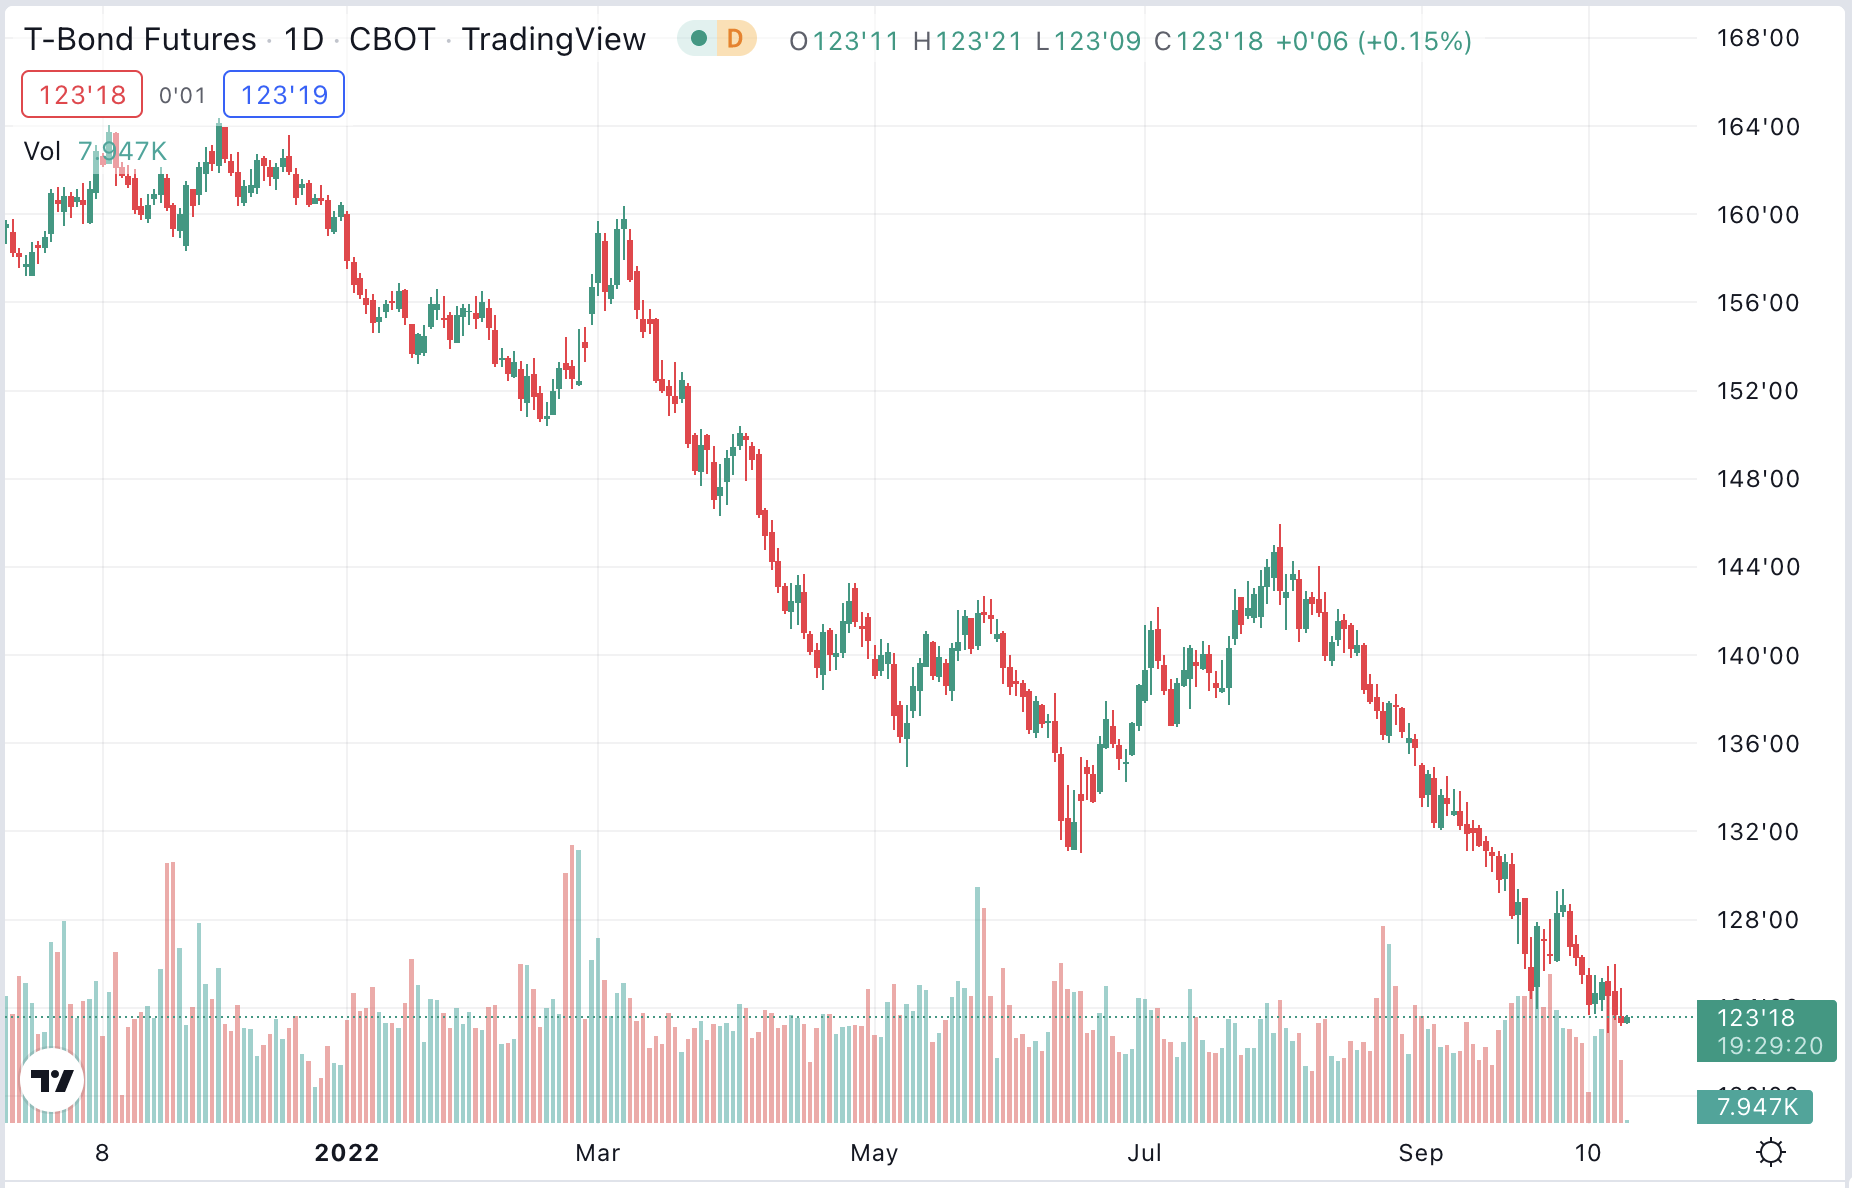
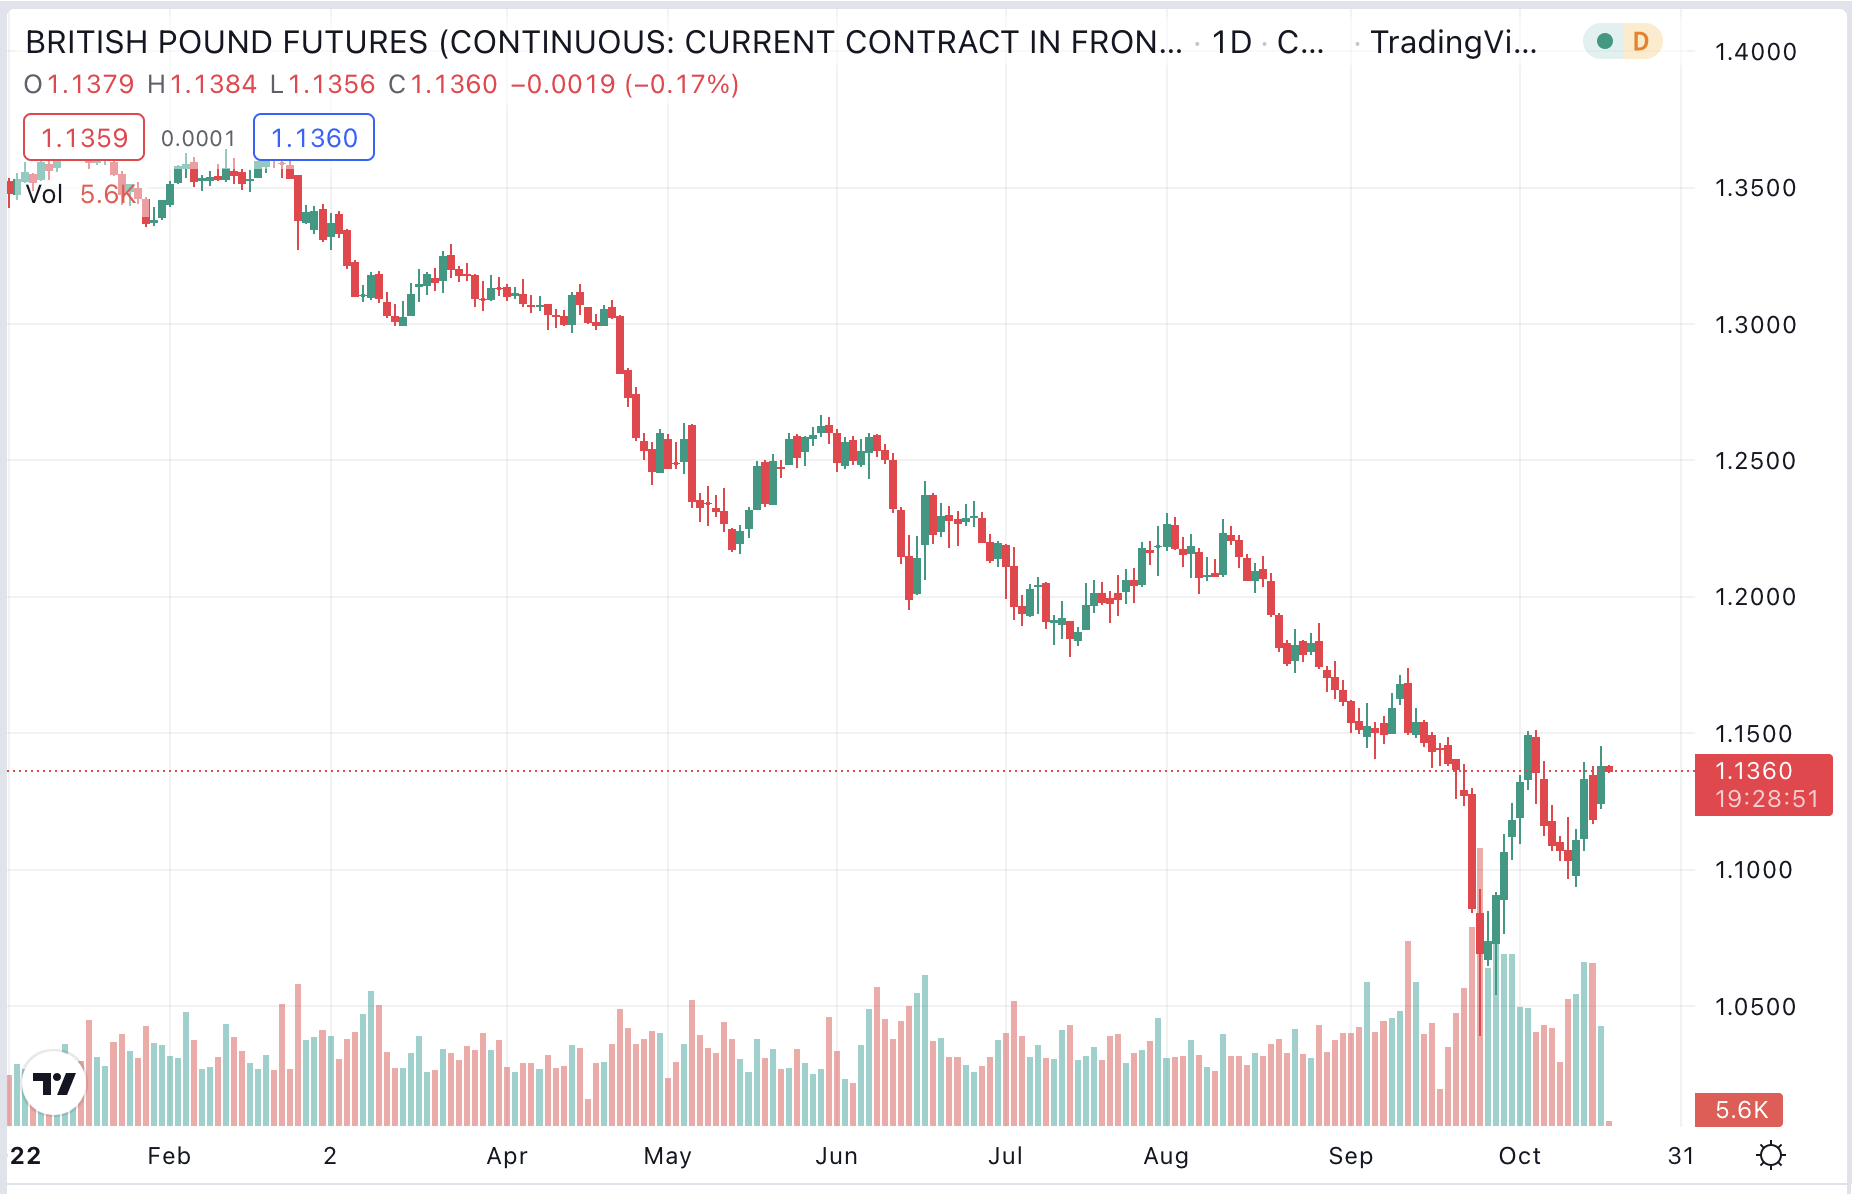
Trend following technology captures greed, fear and basic human nature in big trends up and down. That’s life. That’s how to think and how to profit. Some rip roaring trend following charts in 2026:


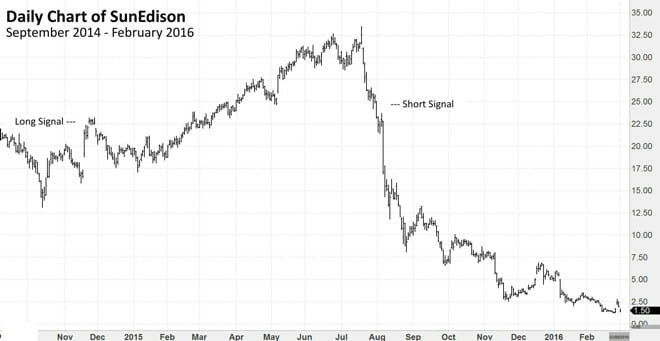
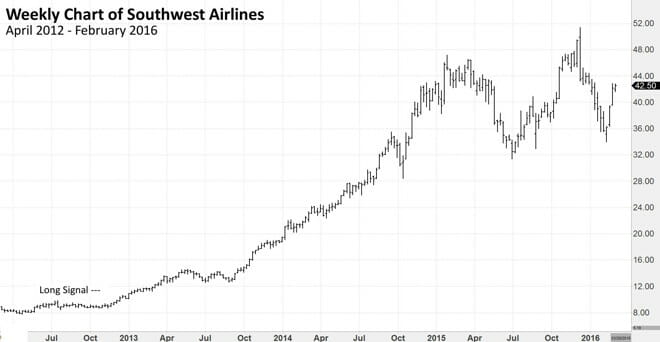
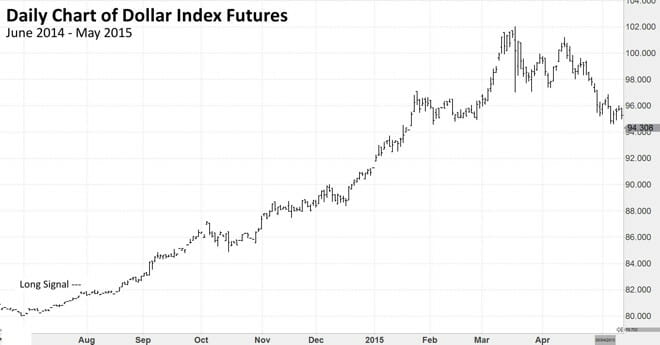
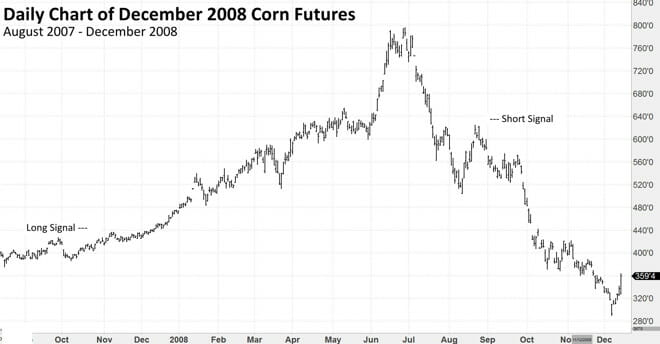
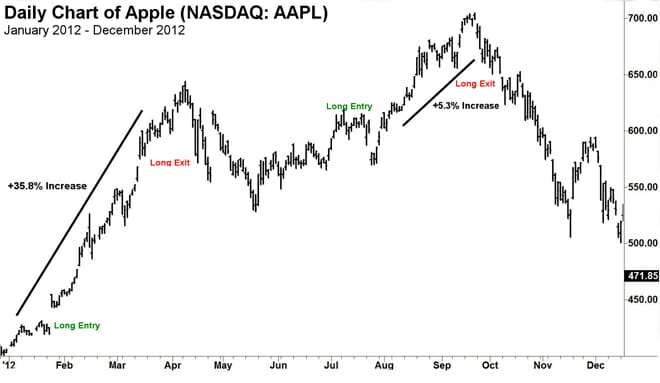
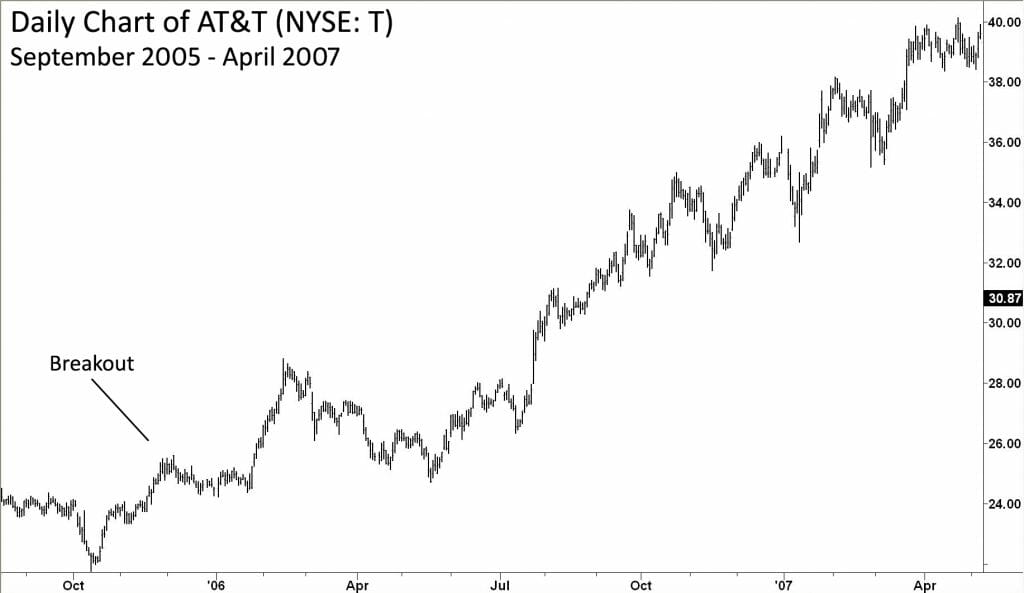
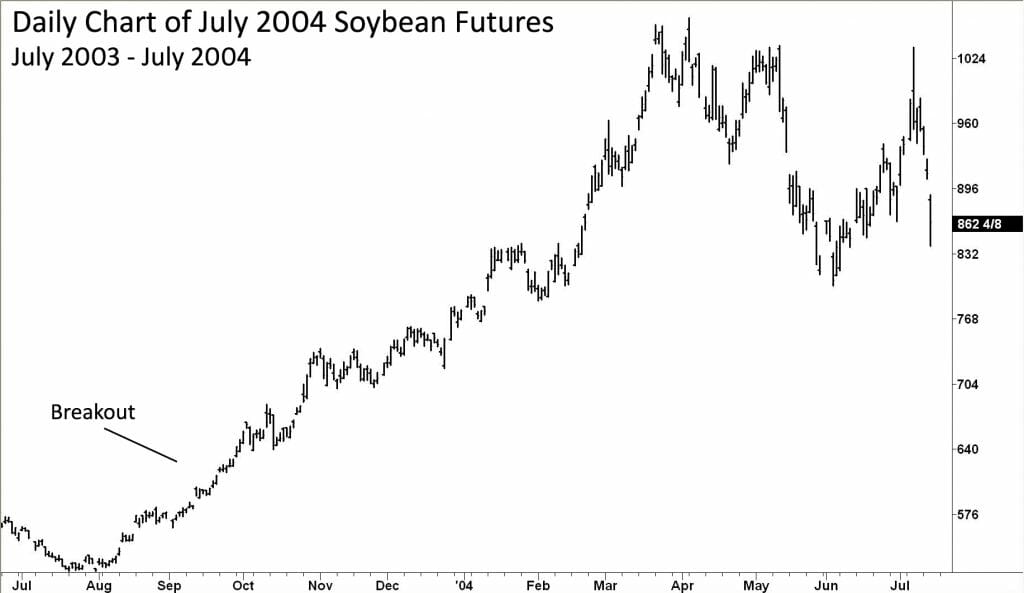
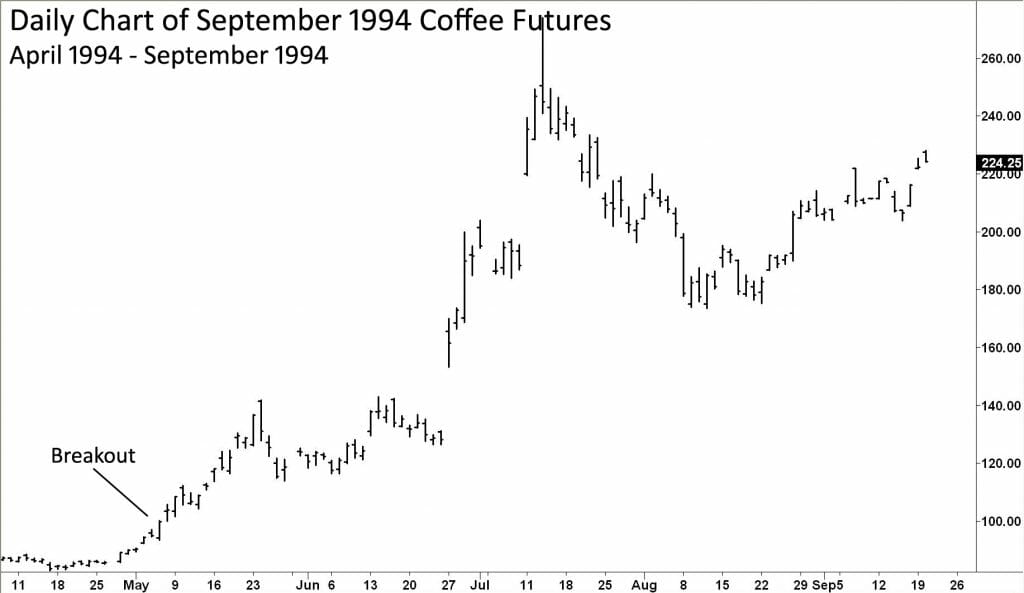
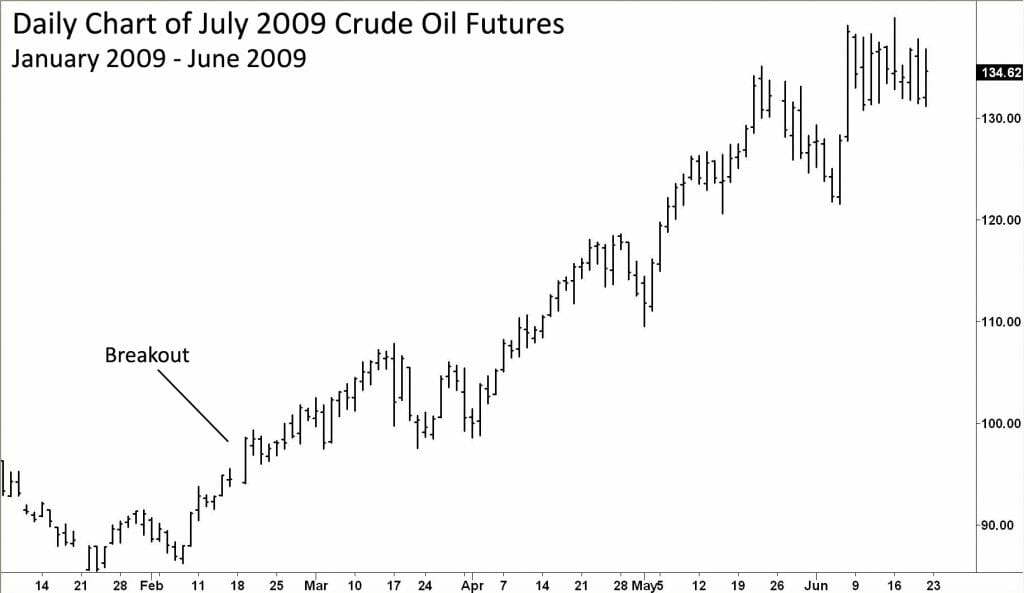
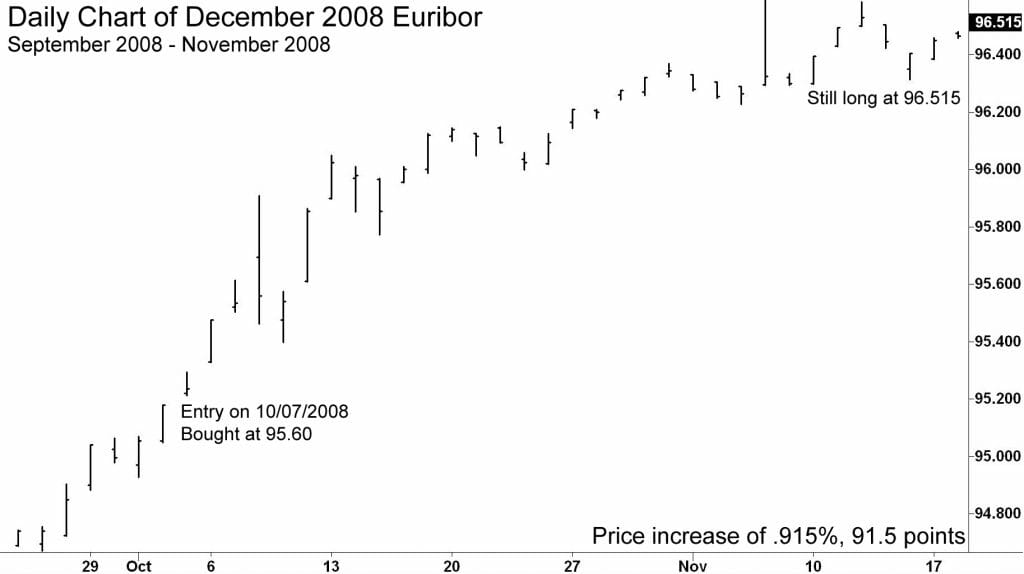
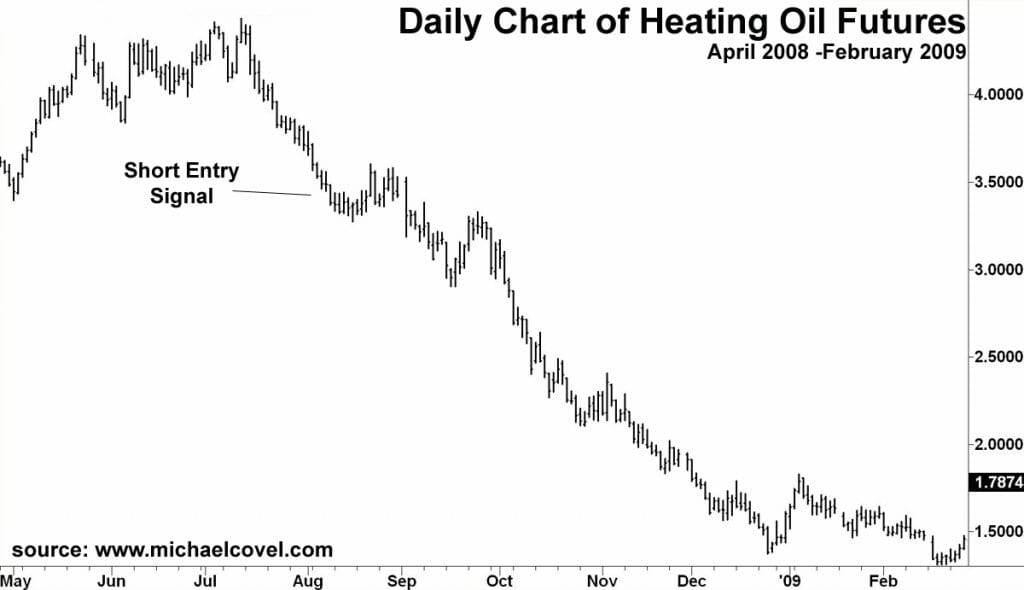
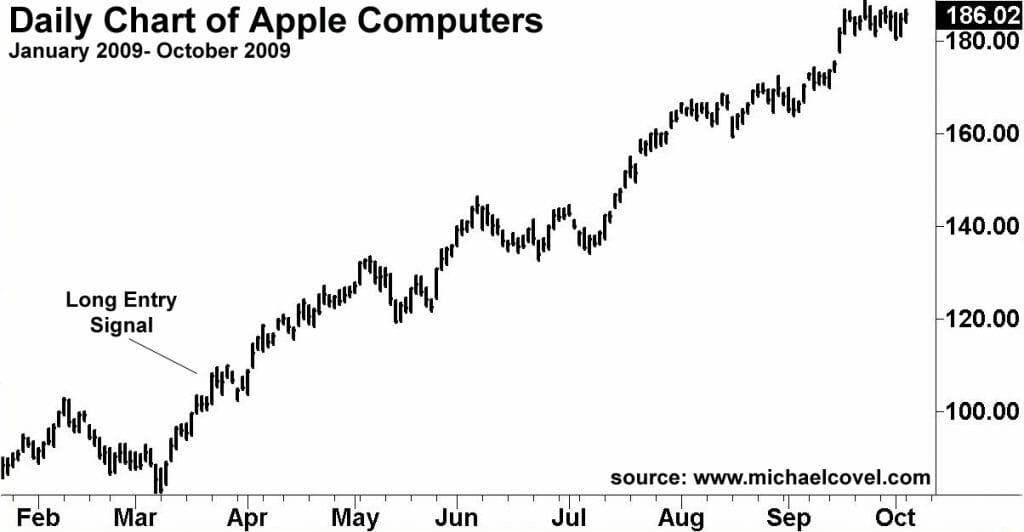
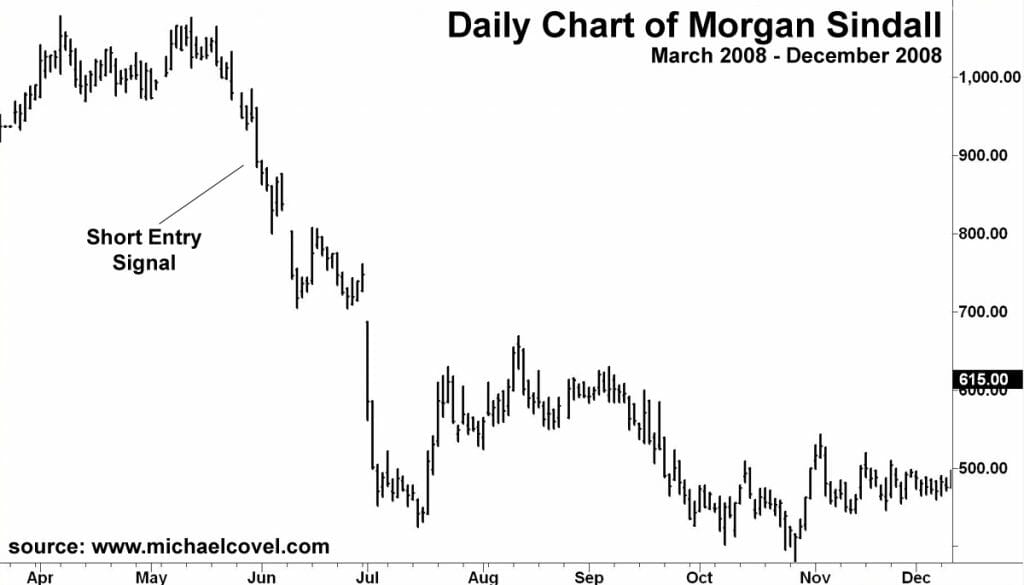
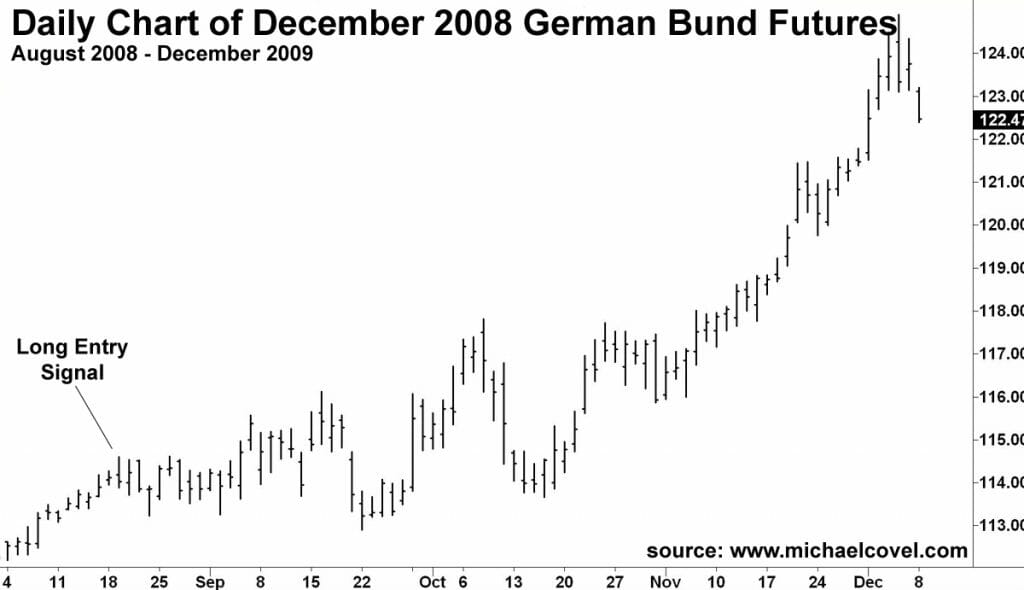
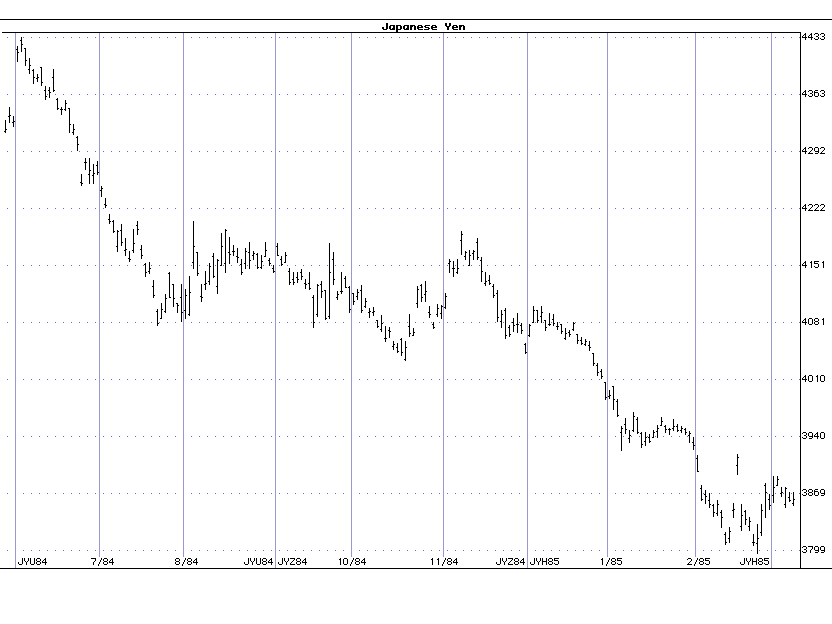
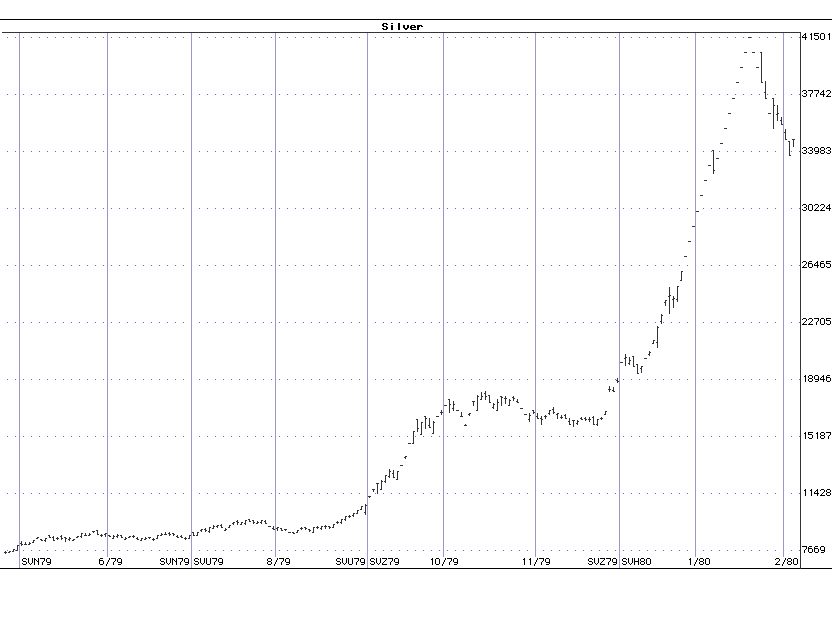
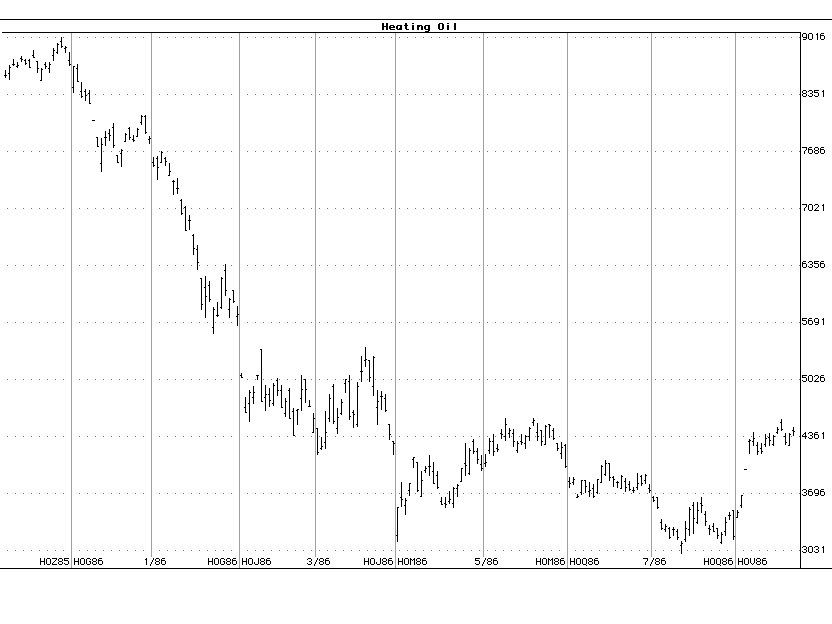
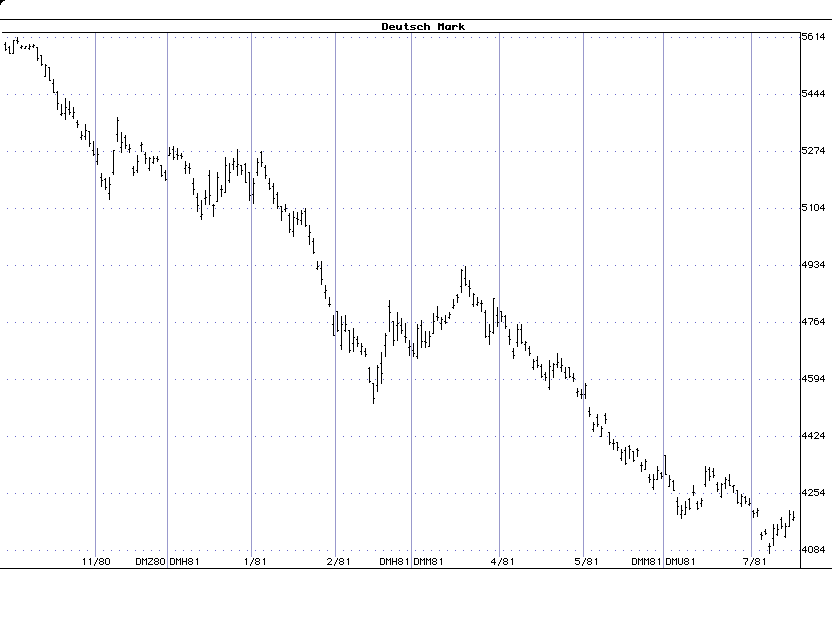
Trend following historical charts:
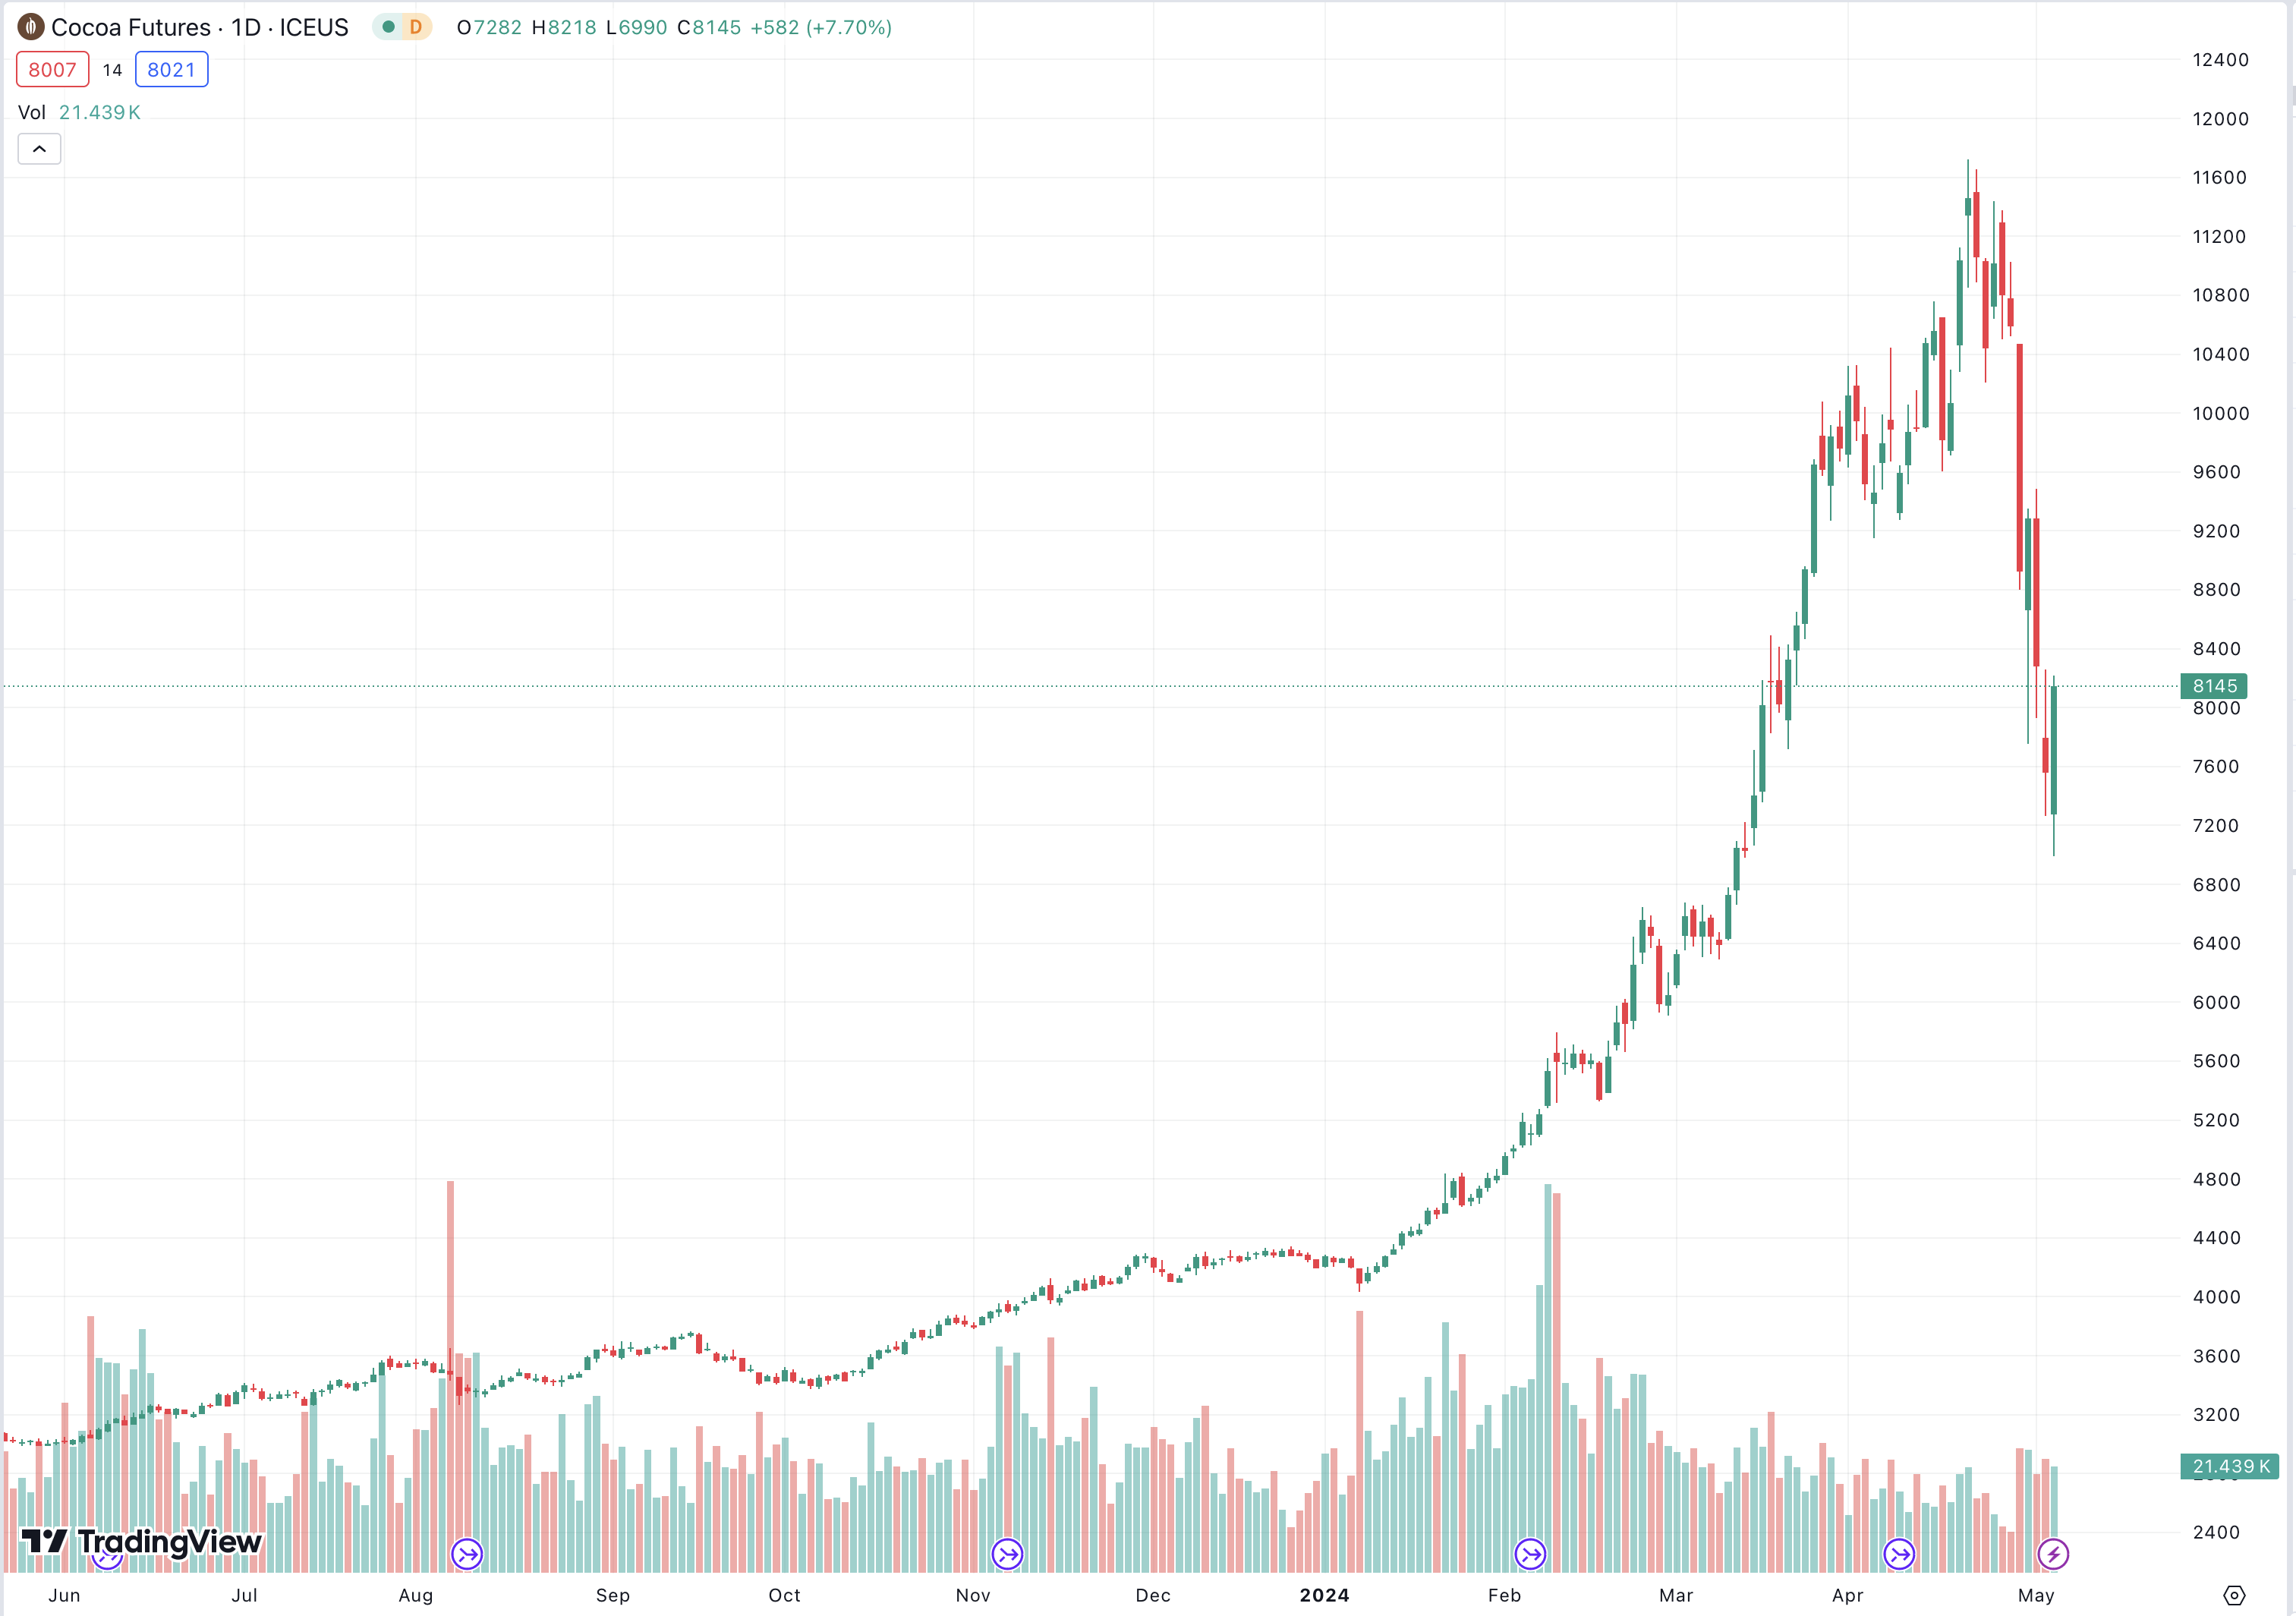
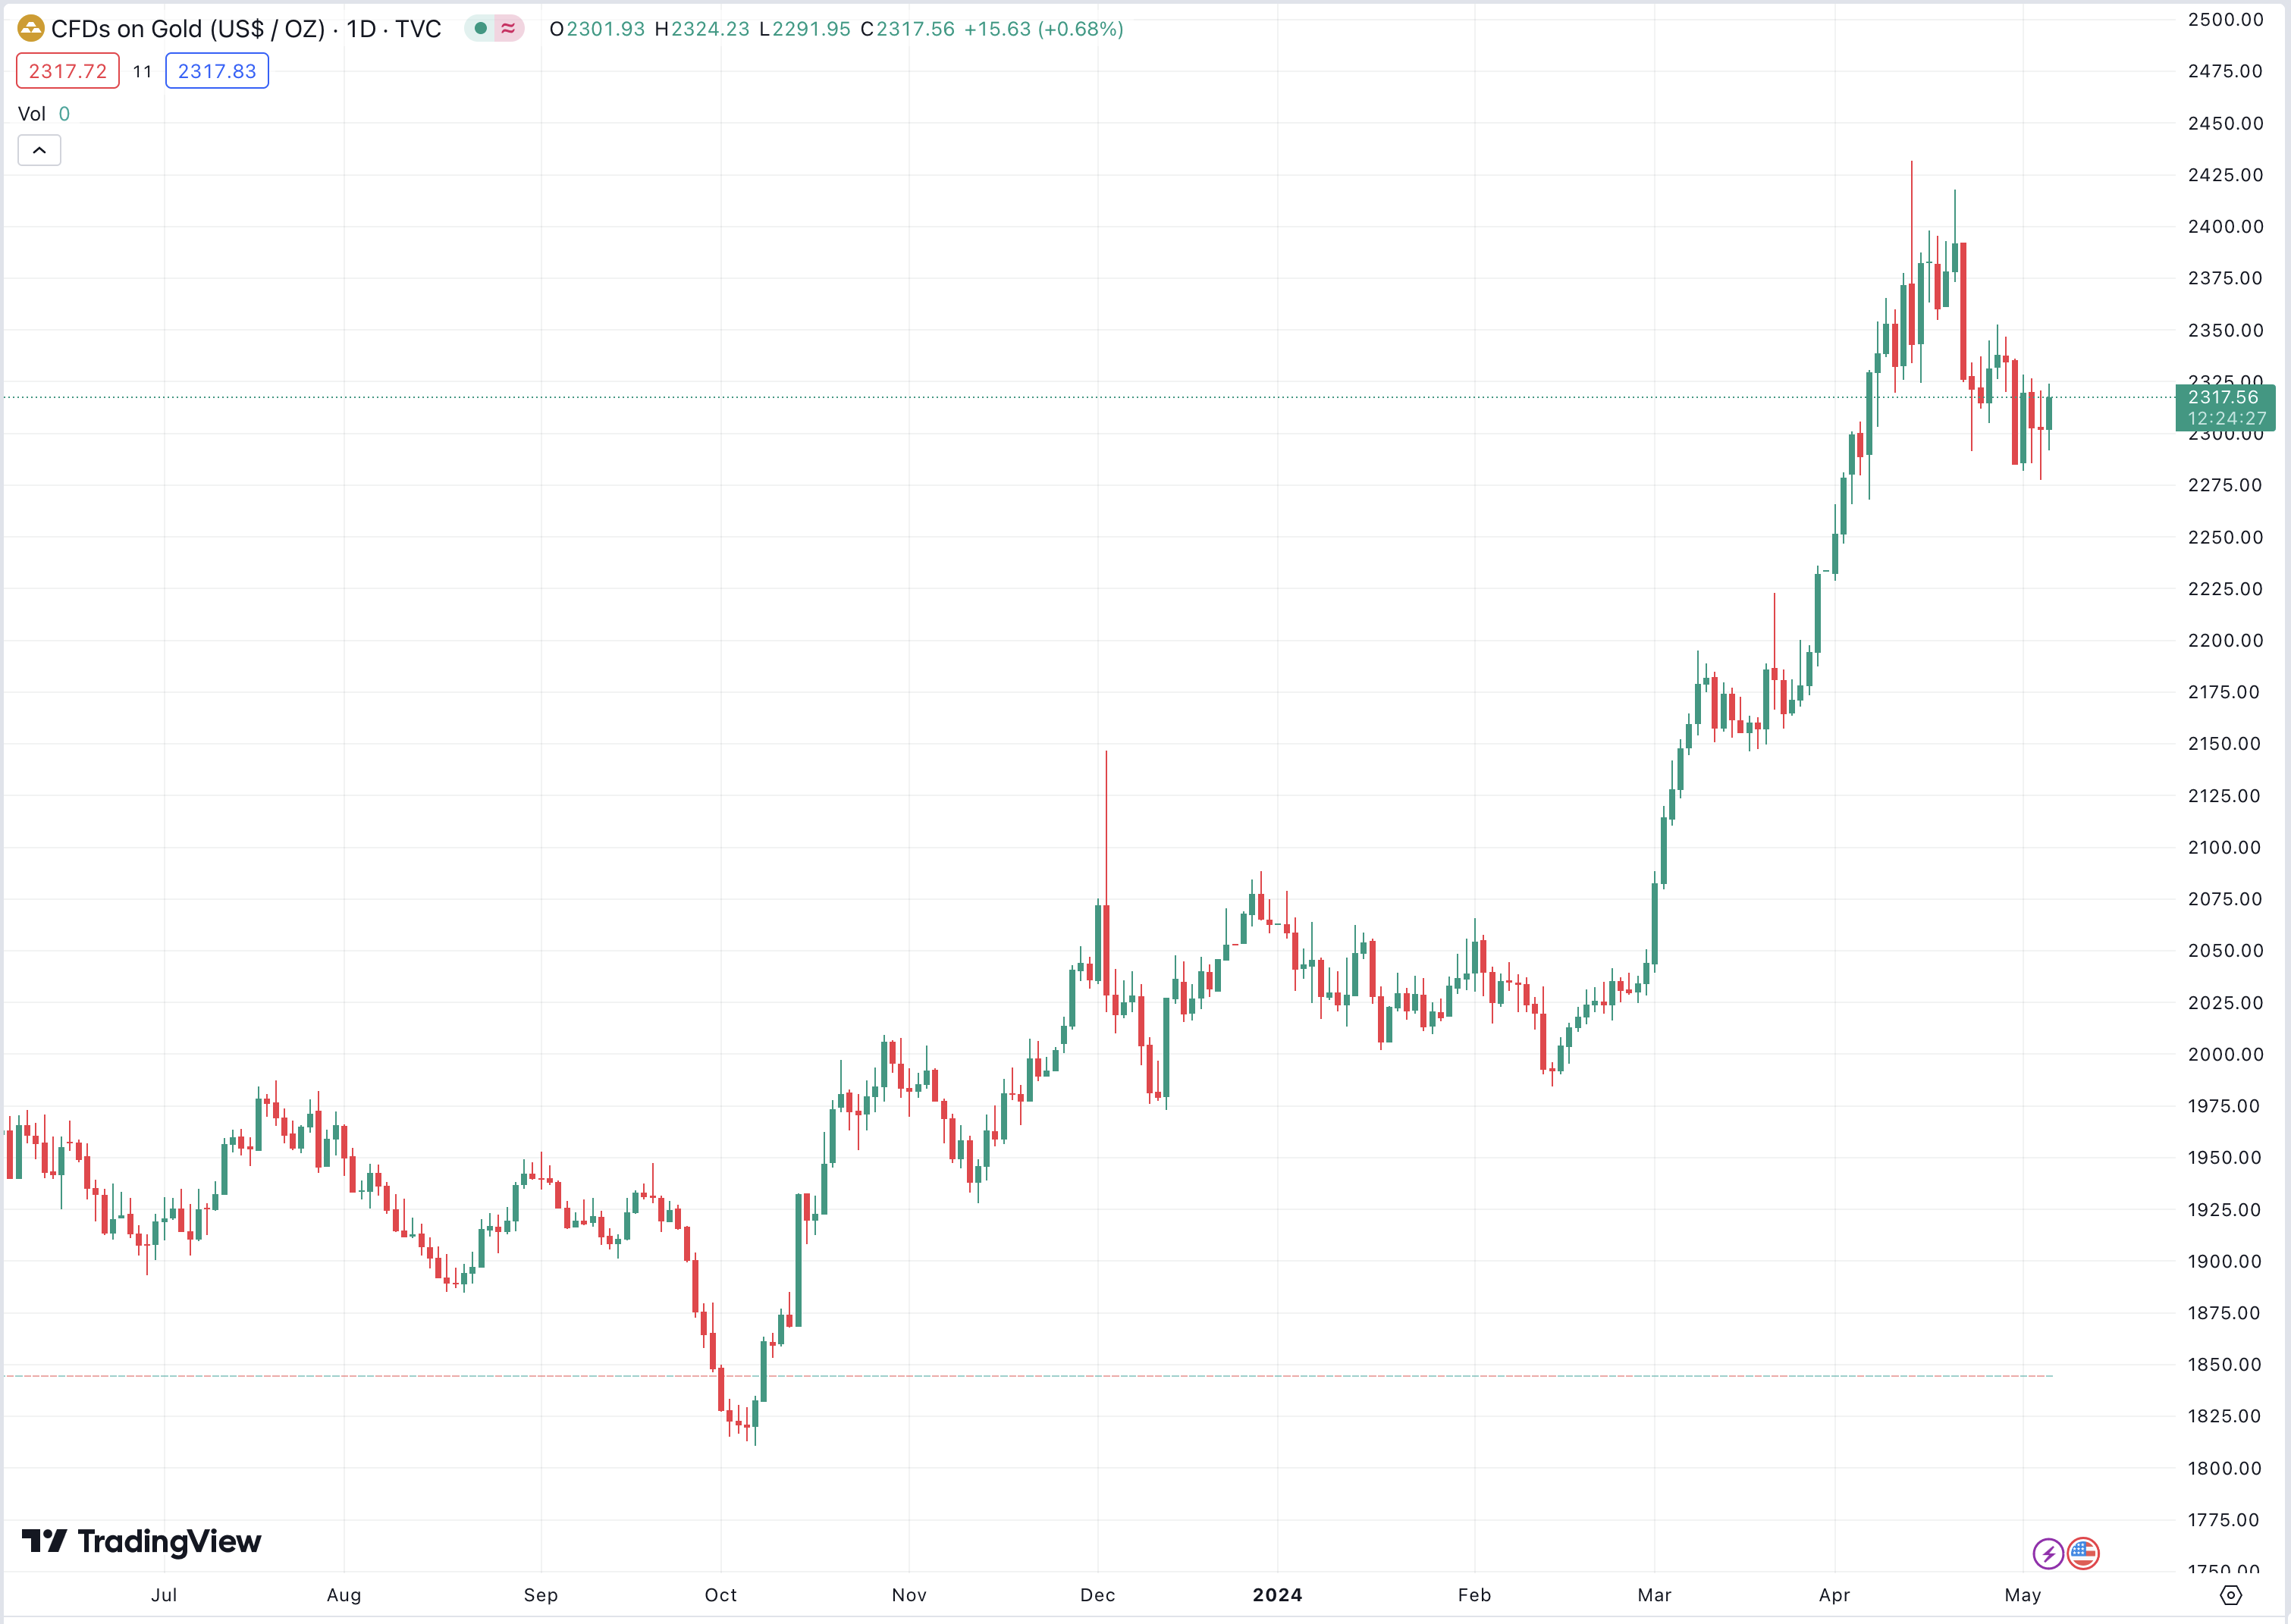
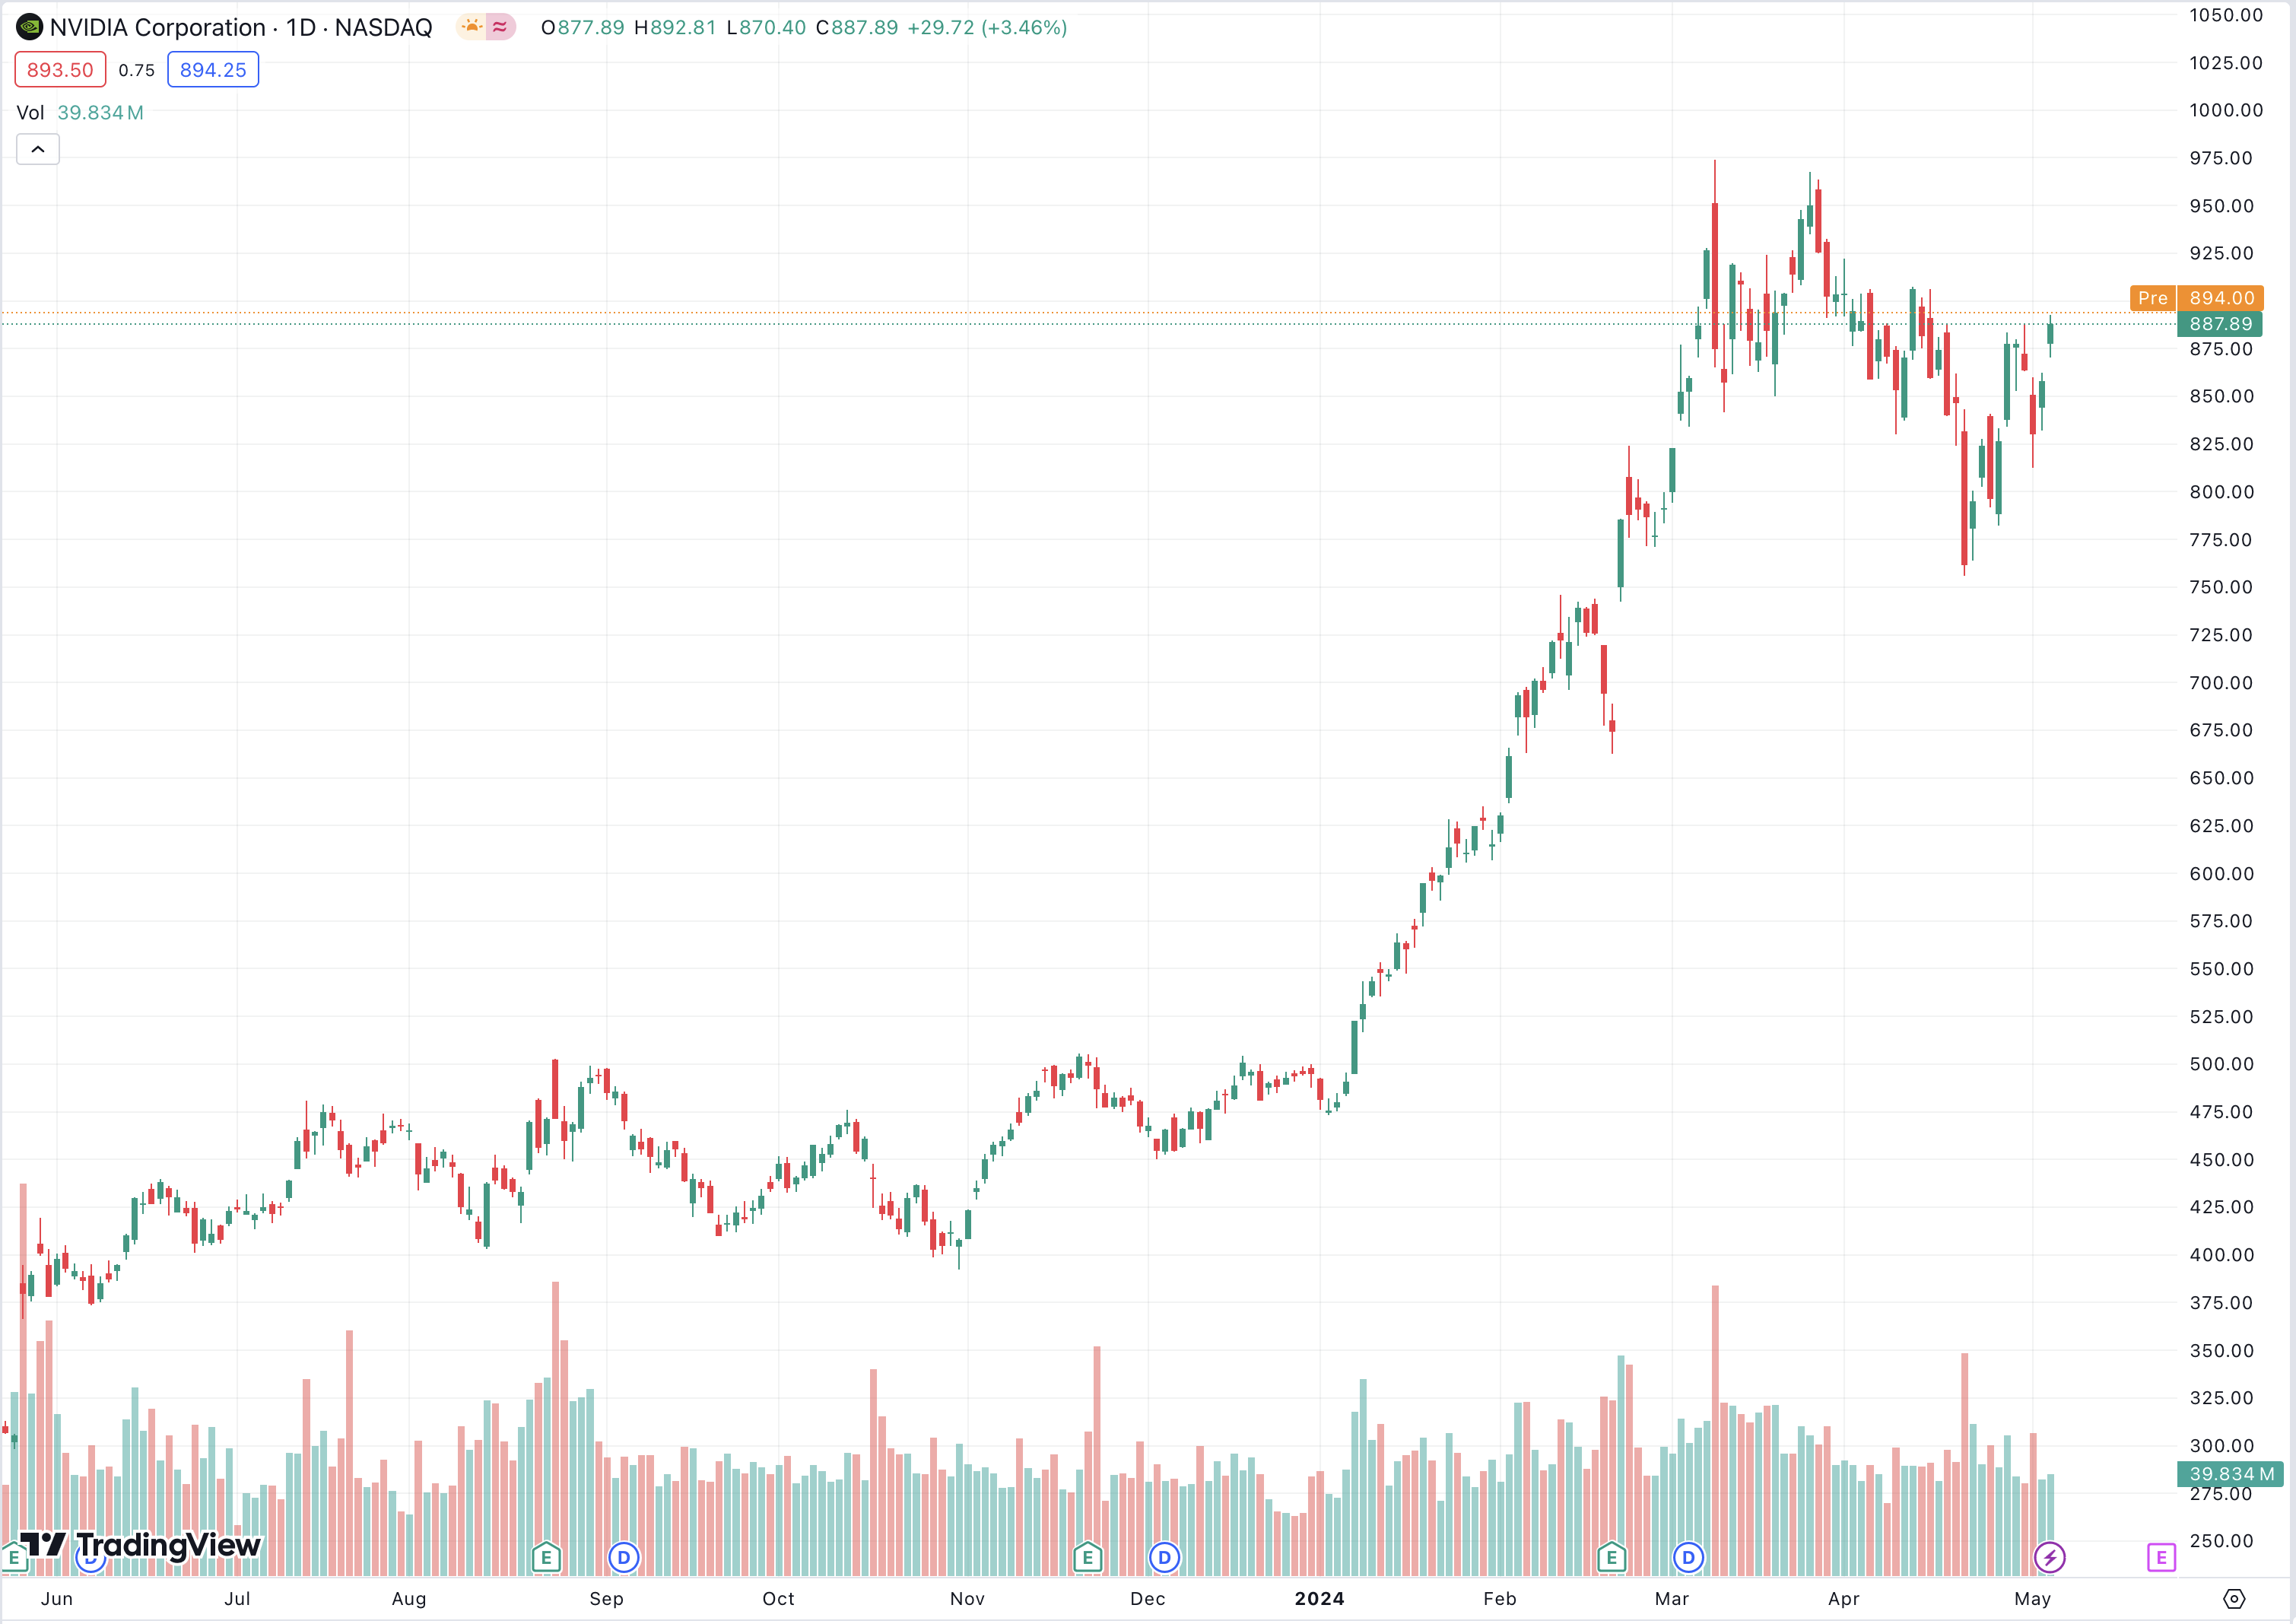
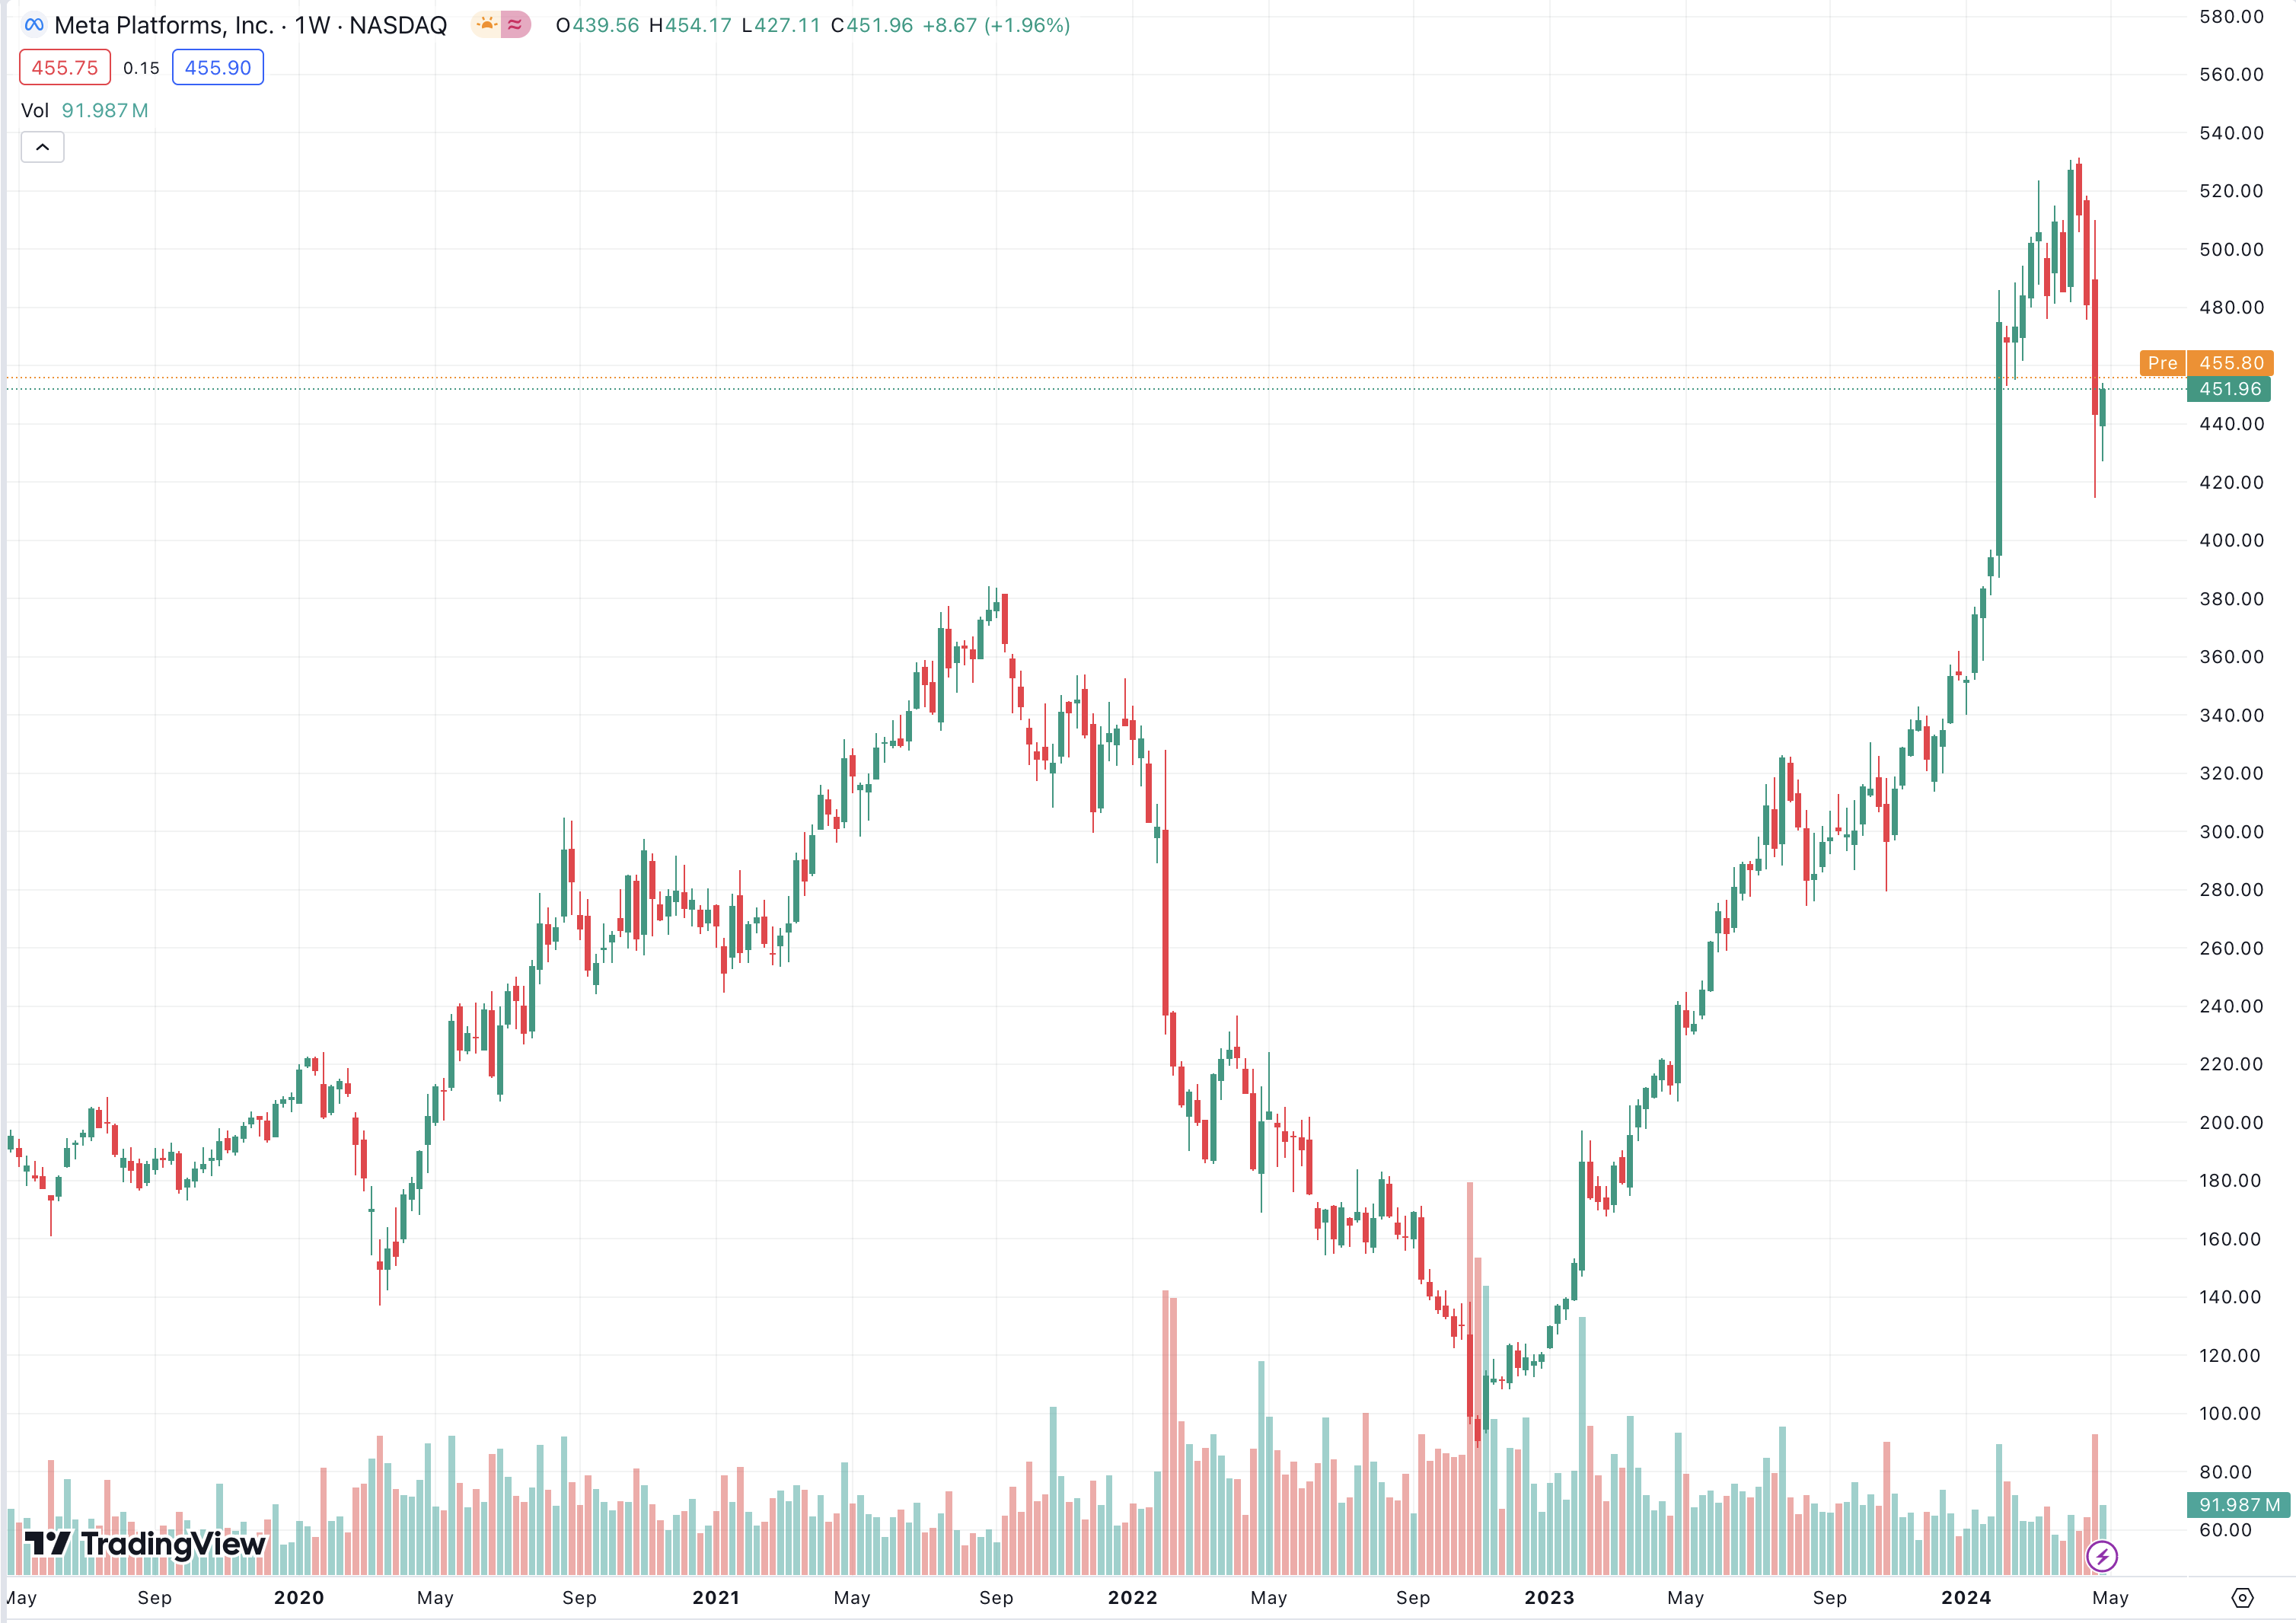
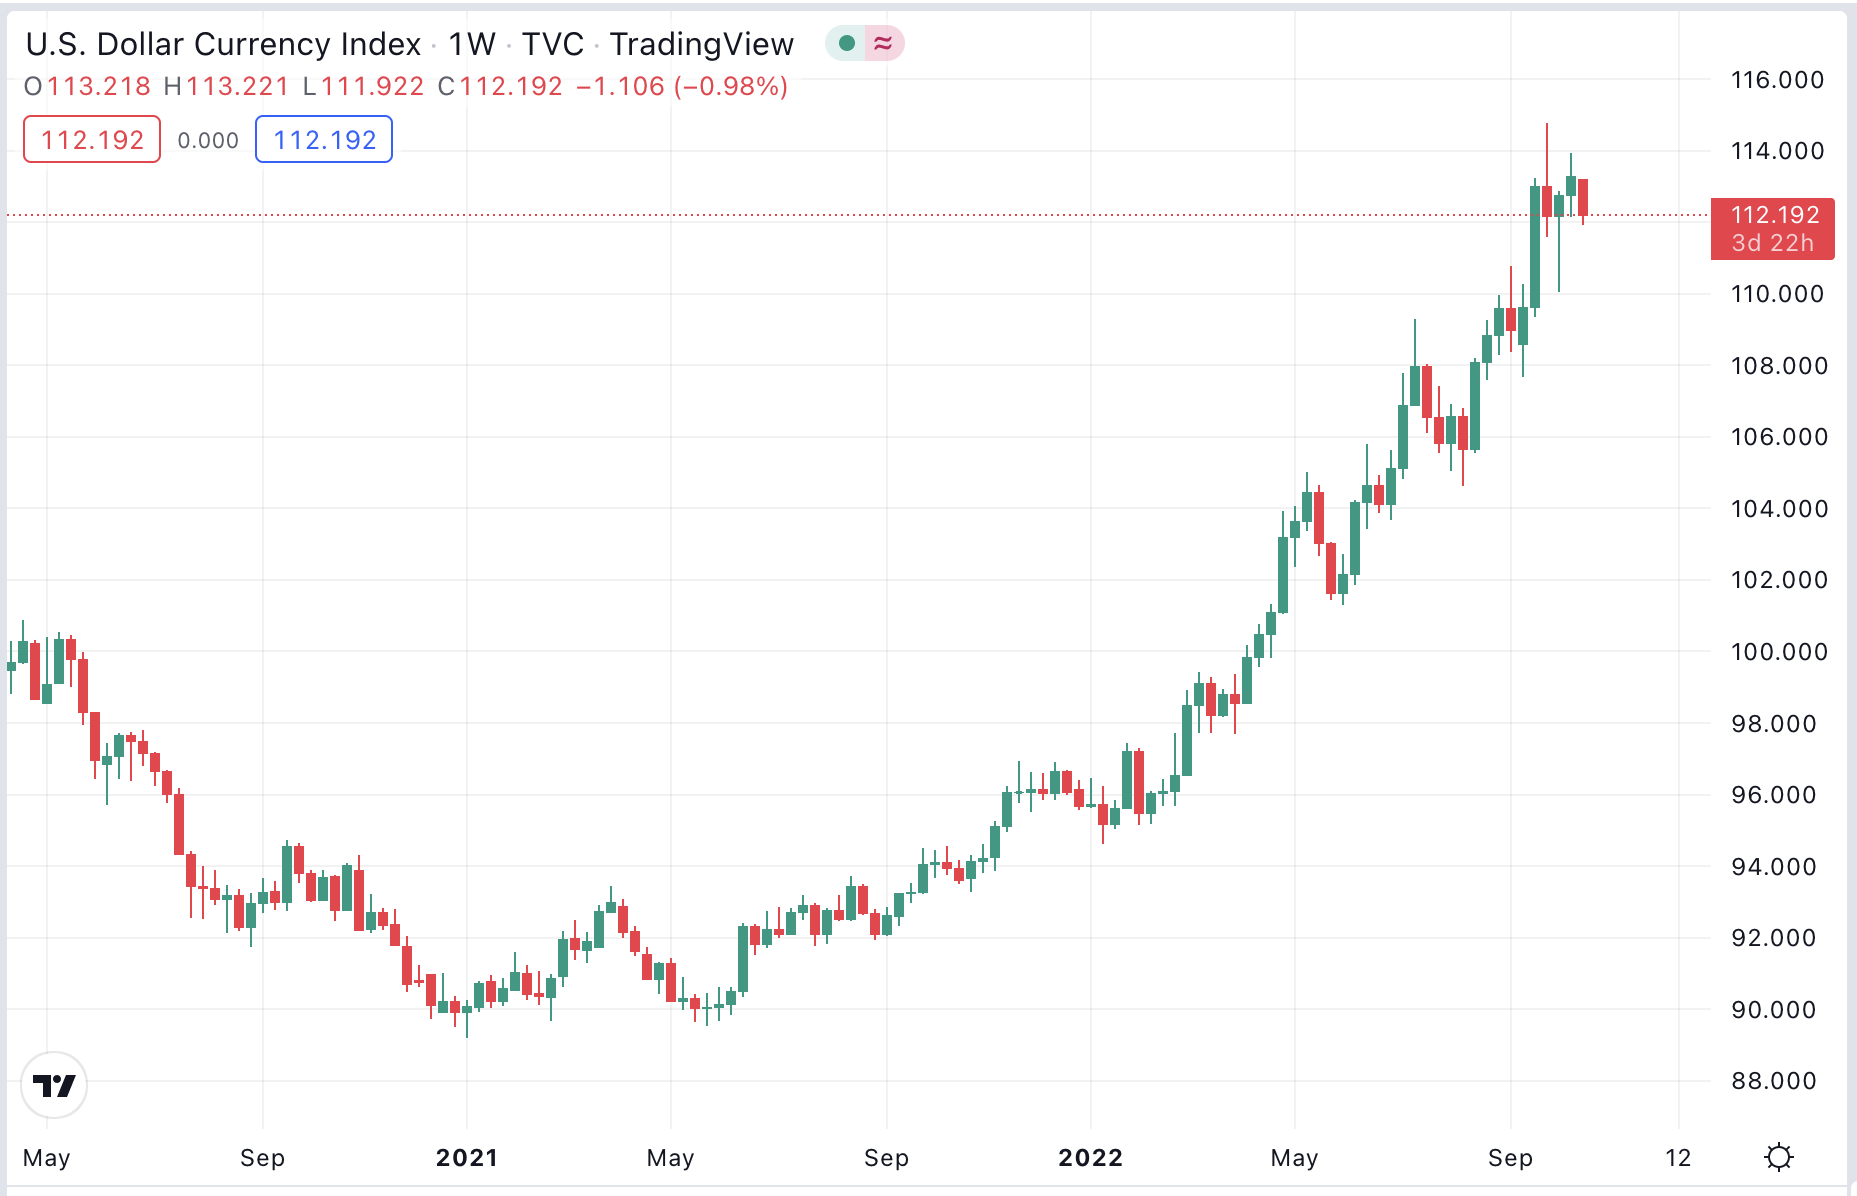
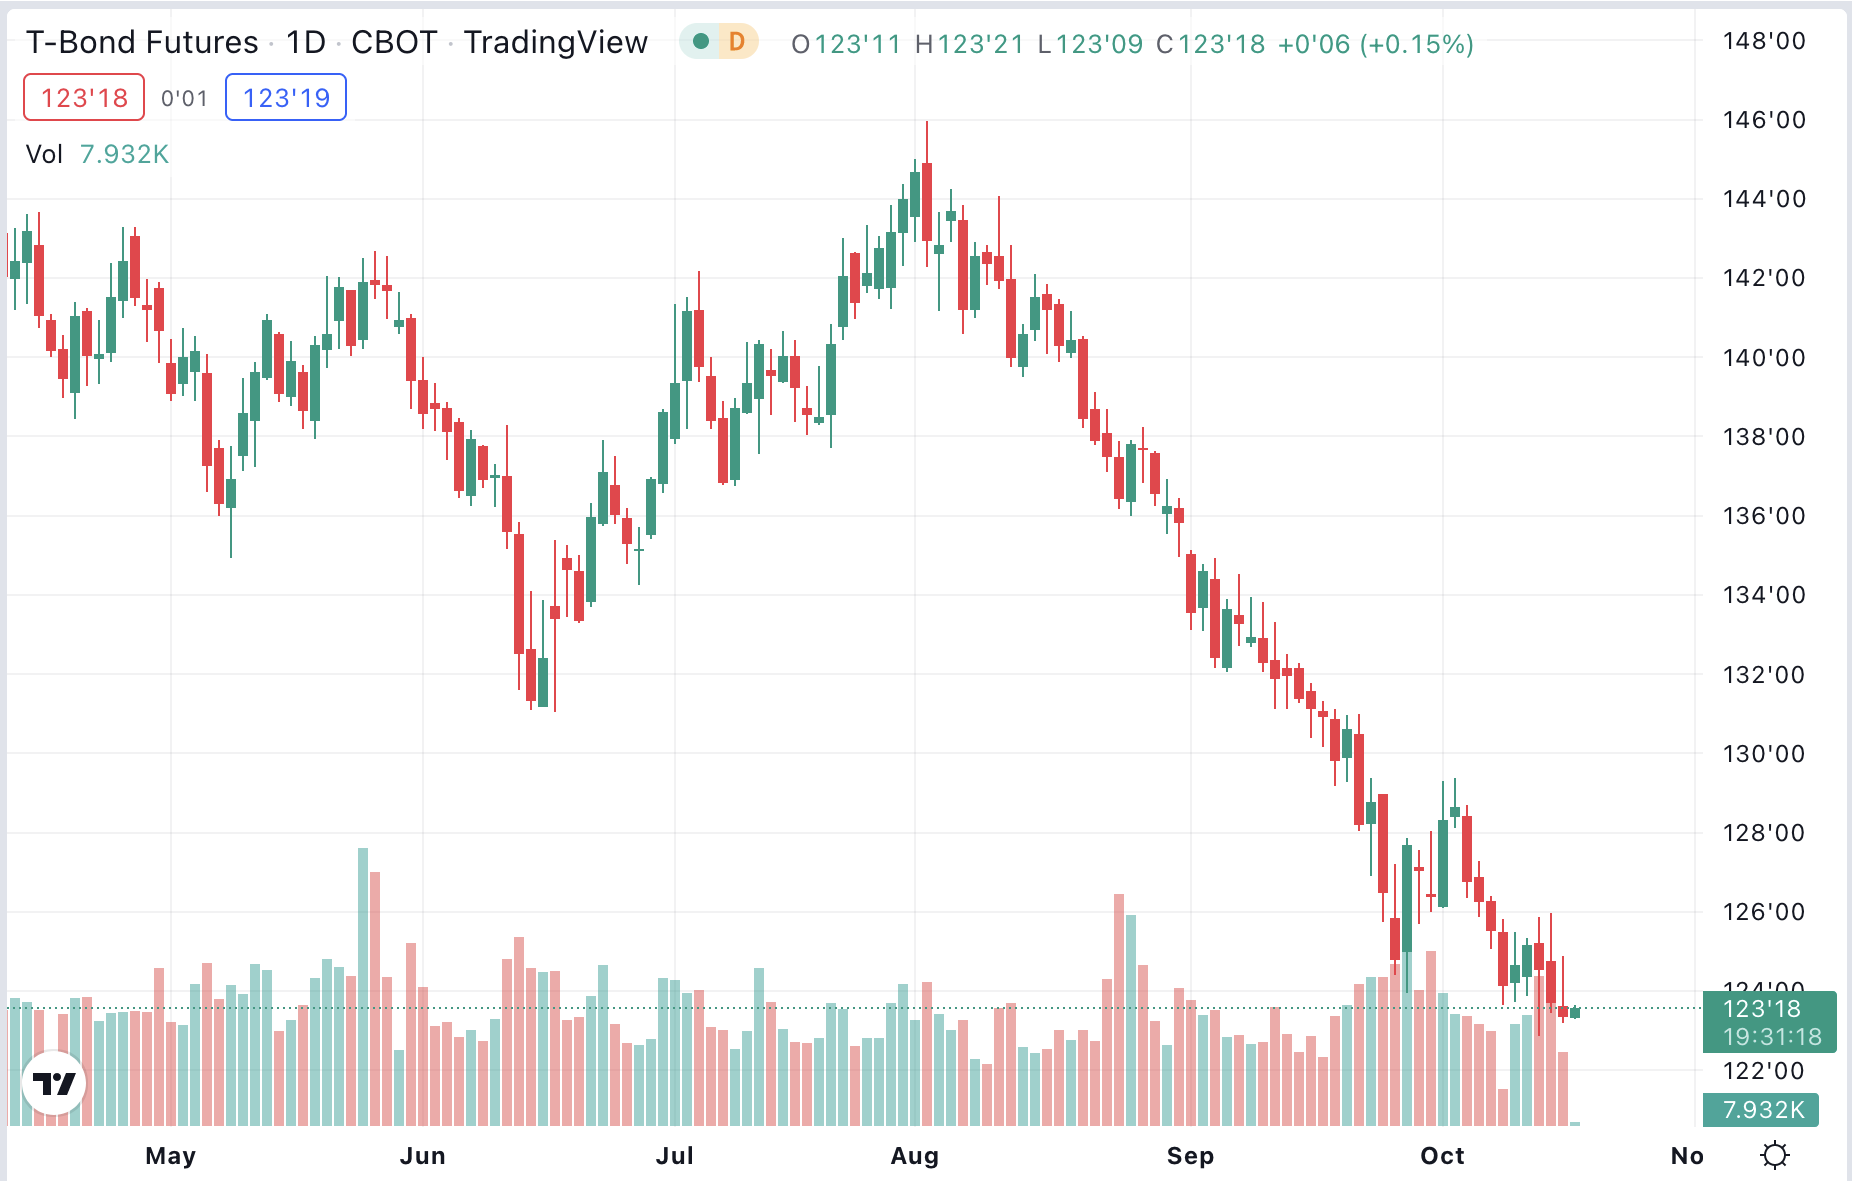
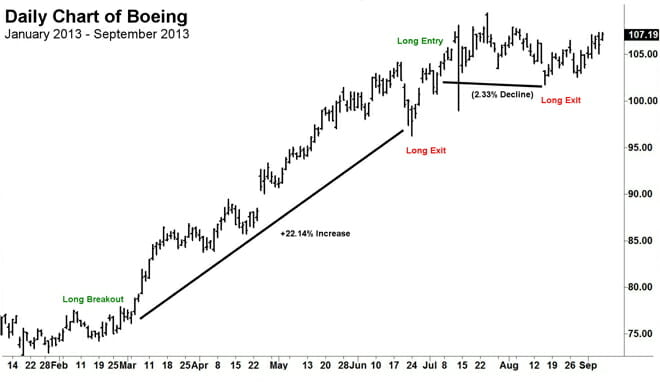
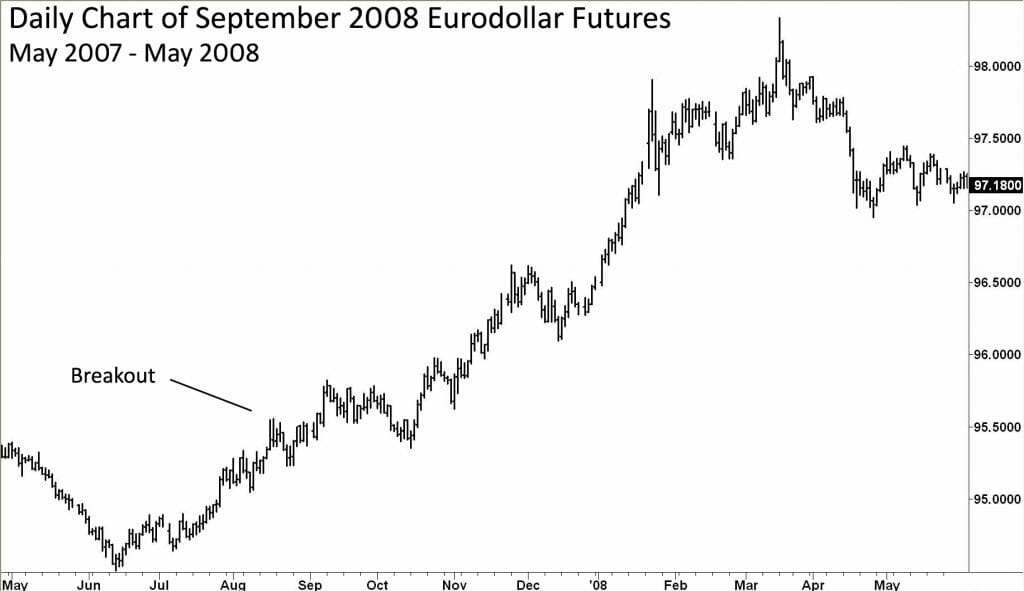
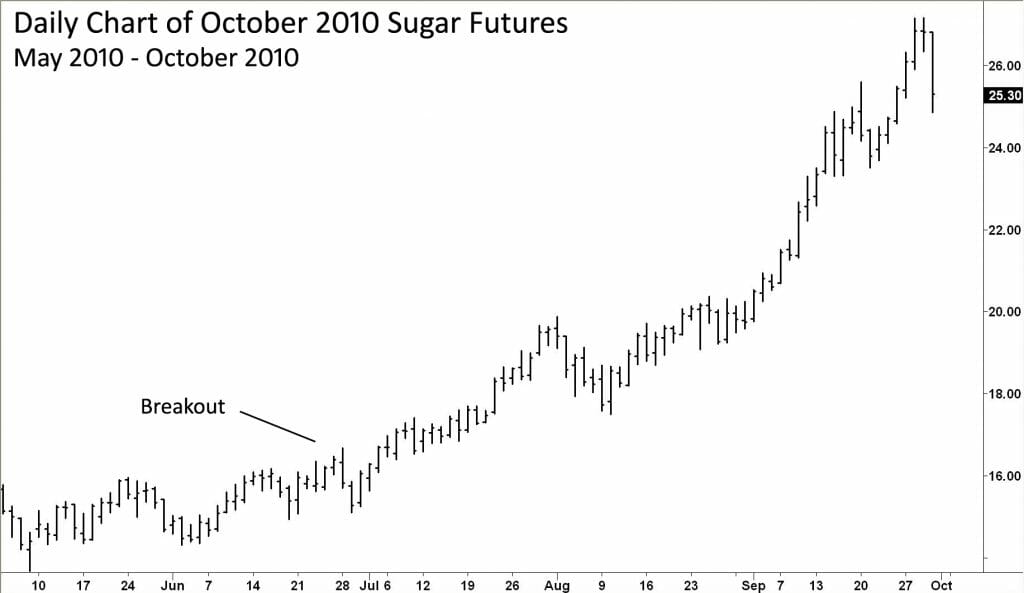
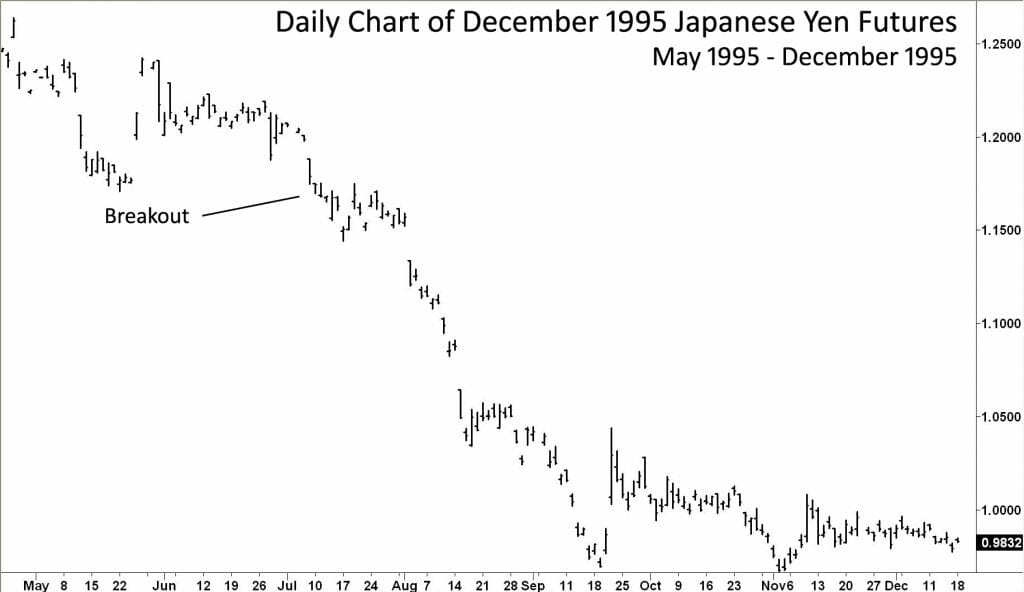
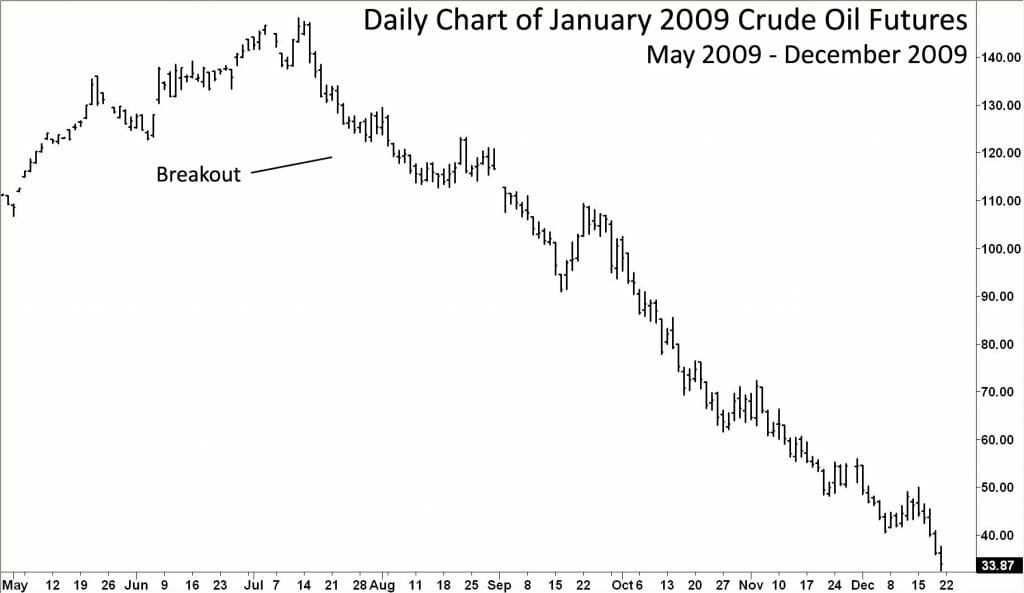
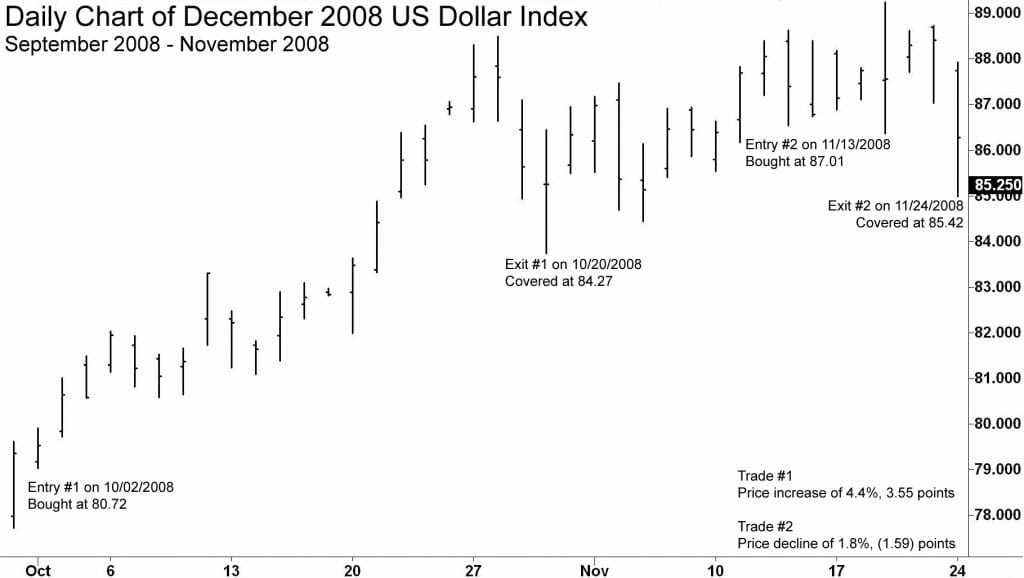
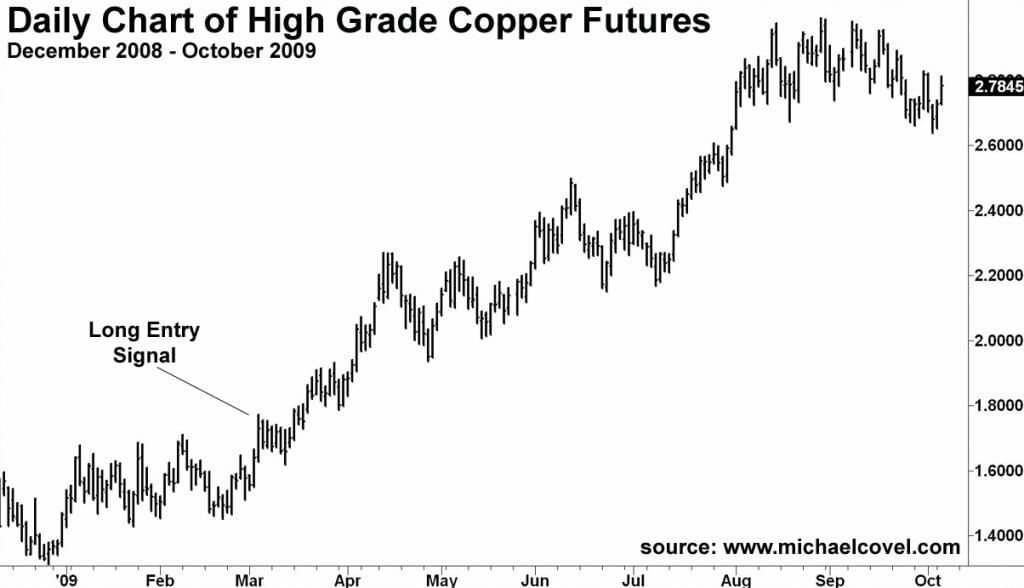
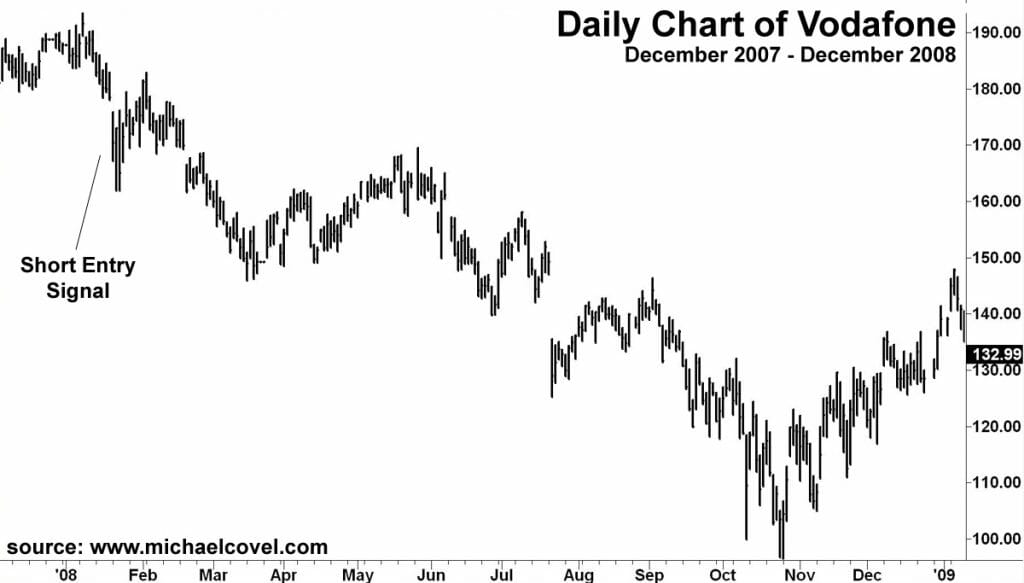
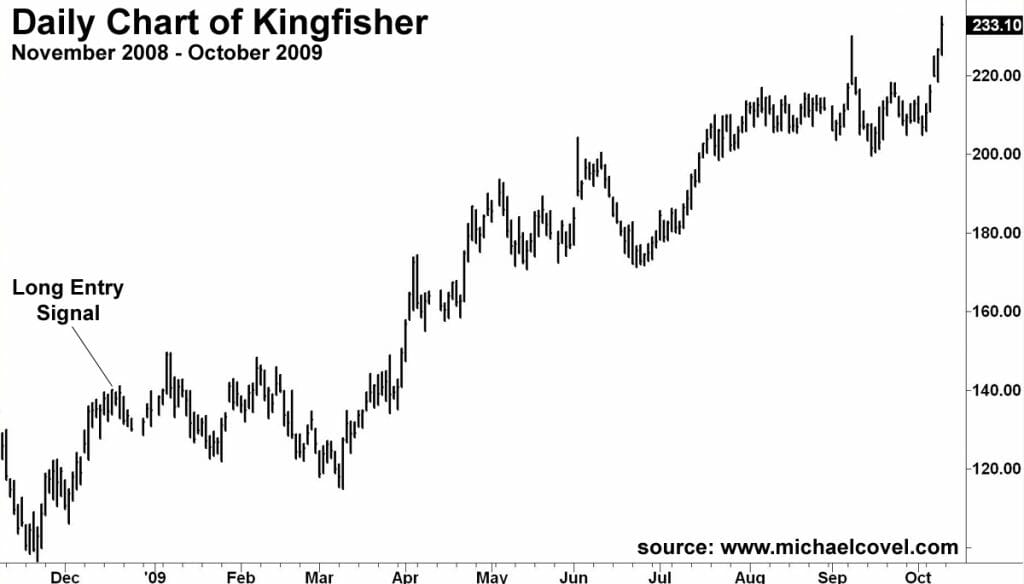
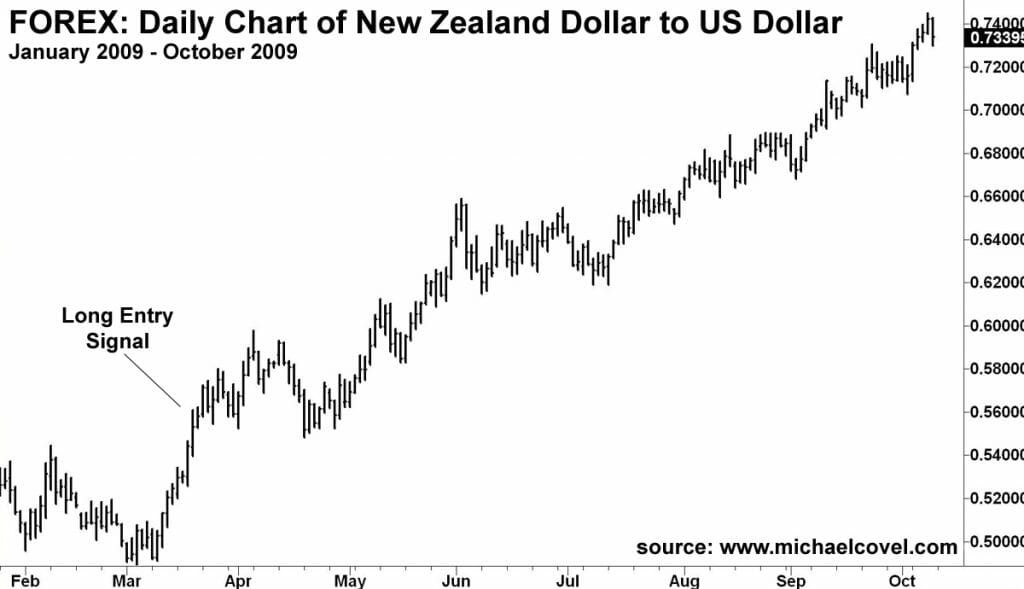
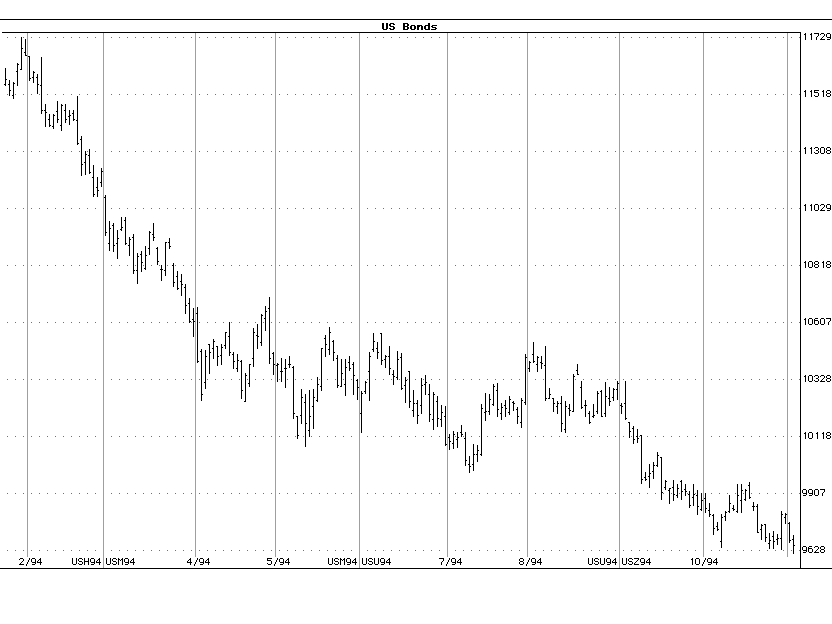
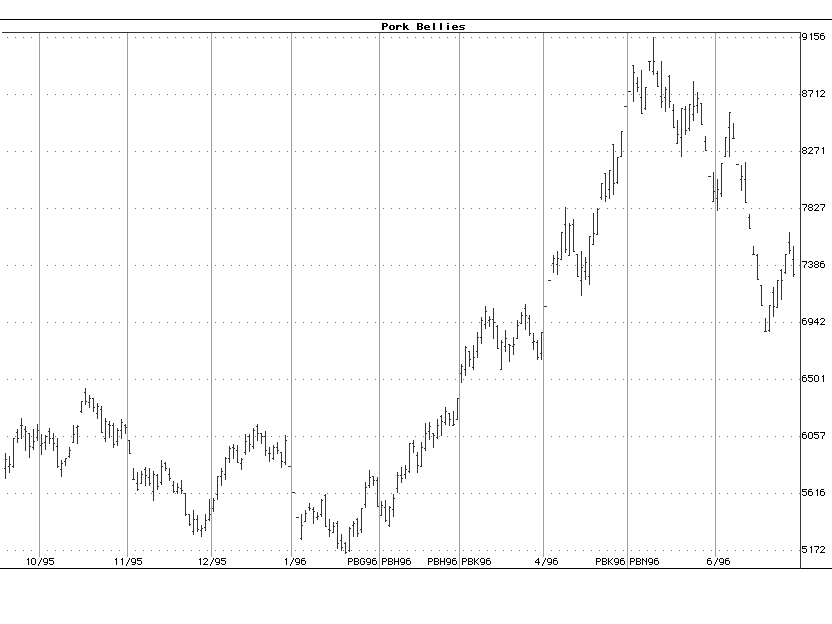
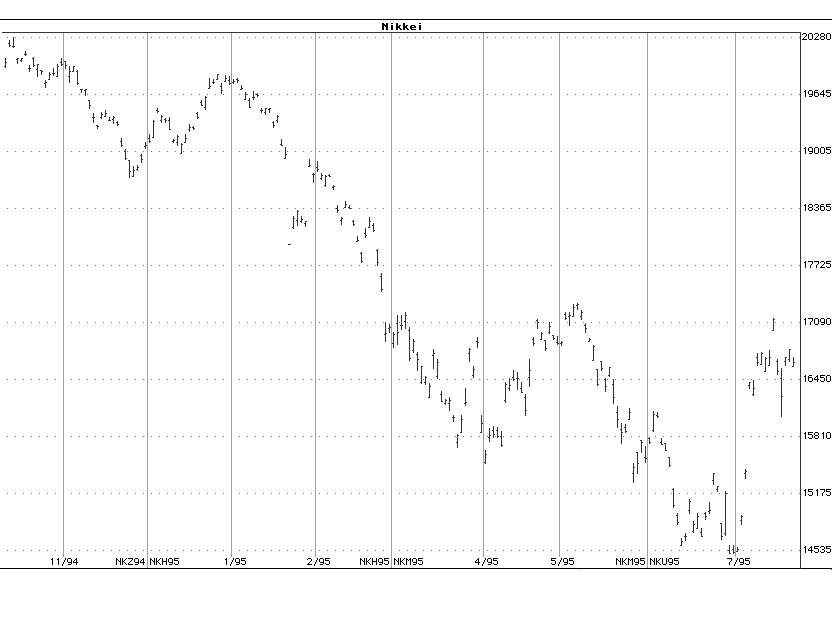
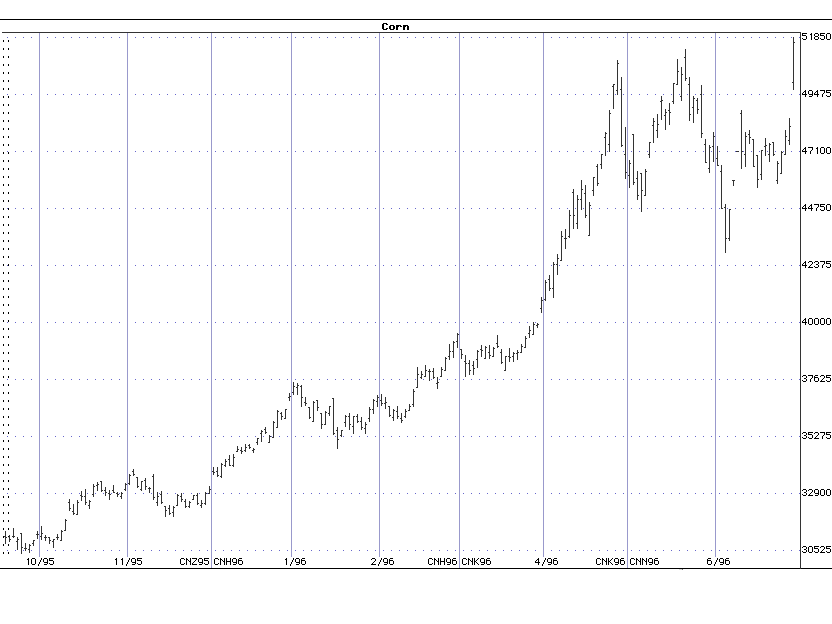
More trend following historical charts:
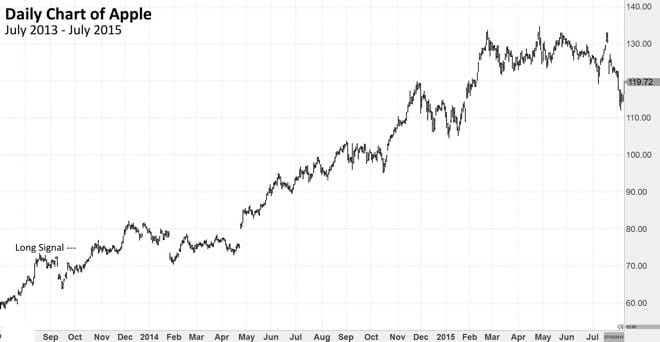
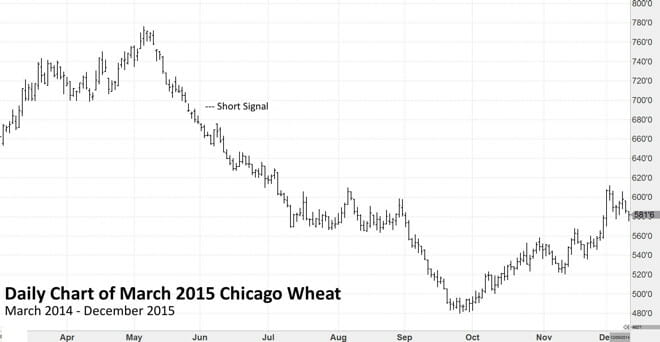
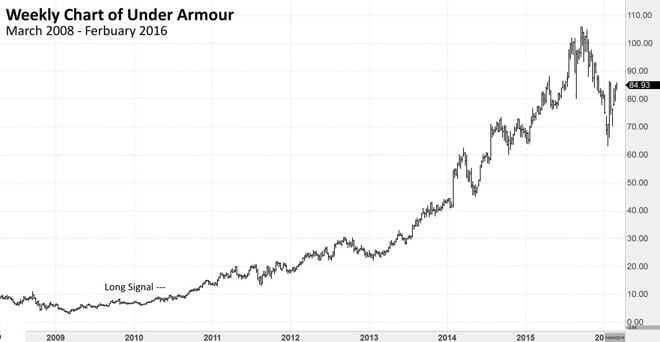

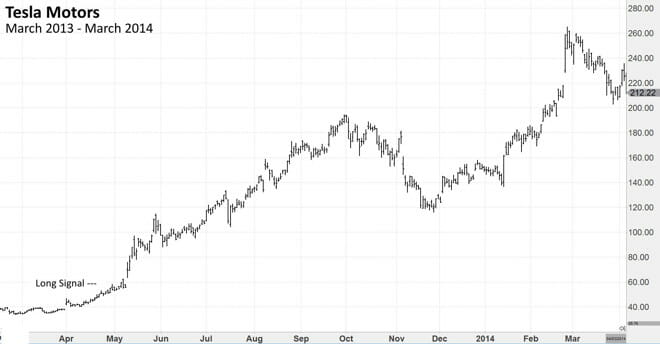
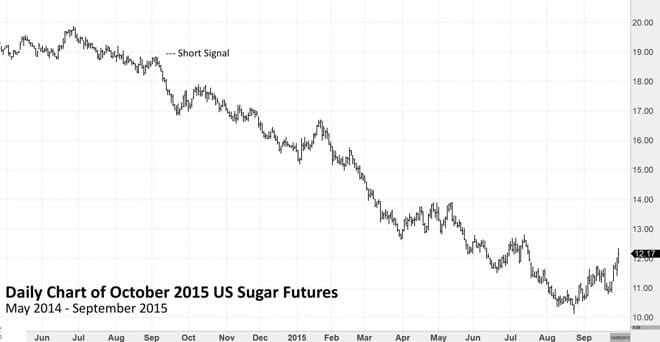
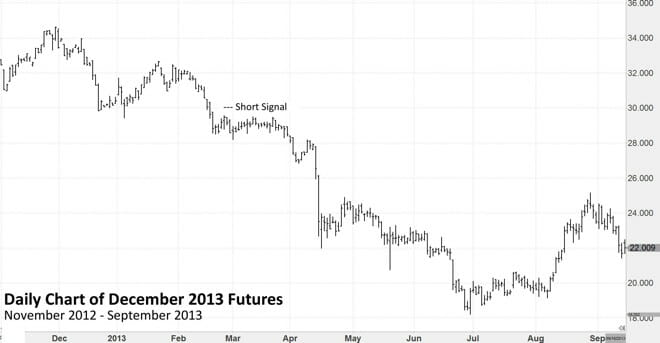
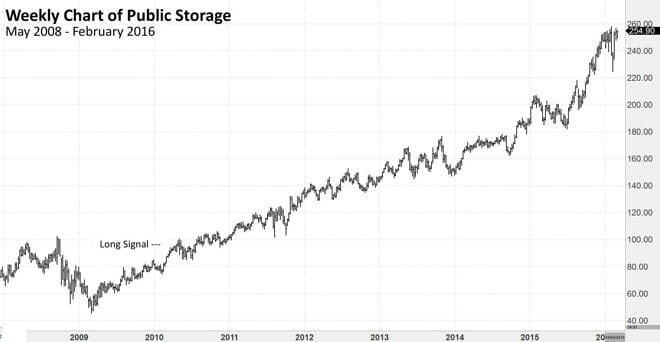
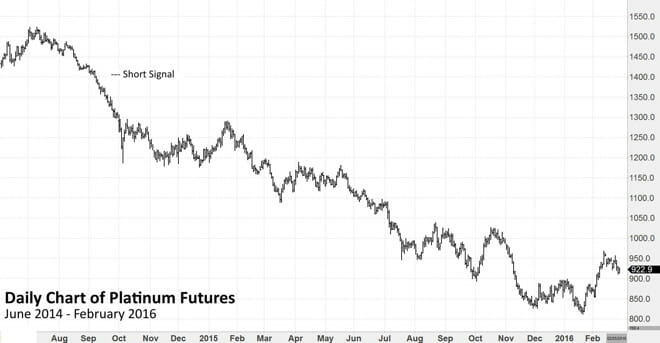
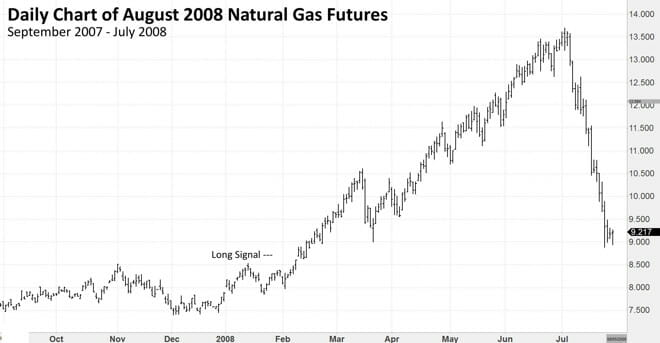
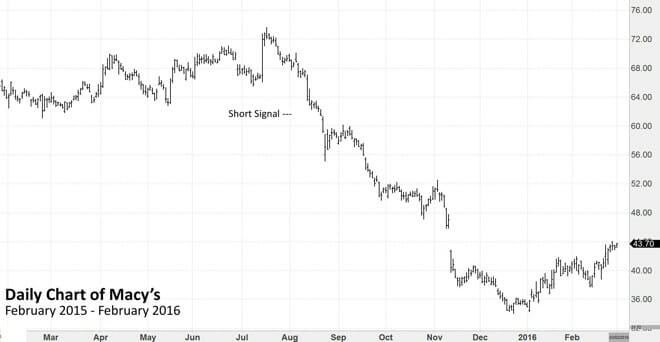
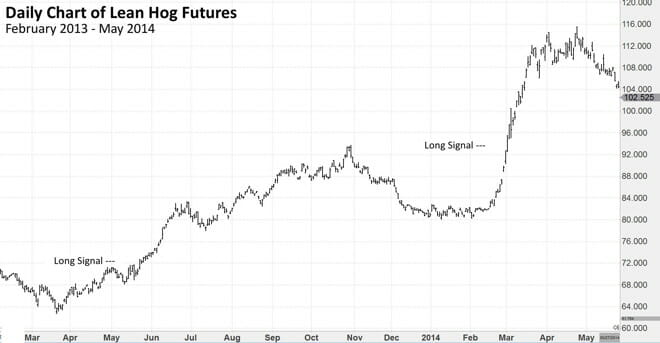
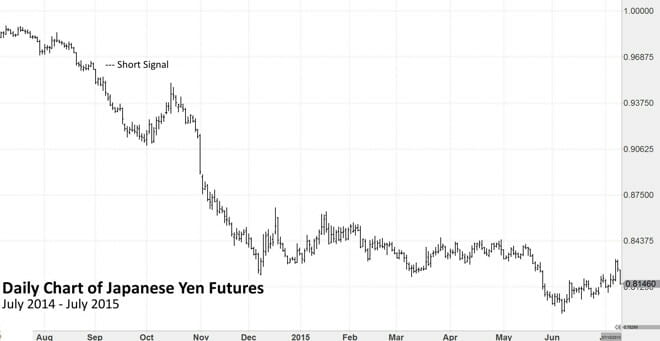
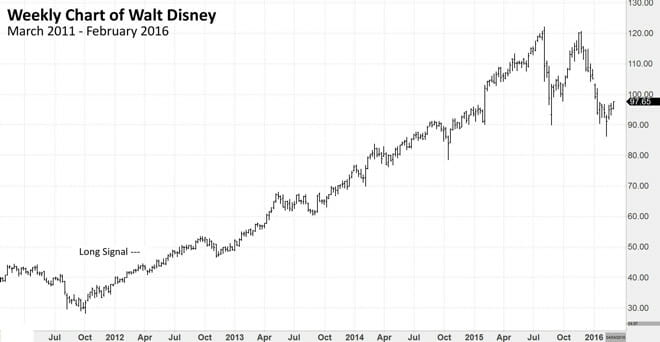
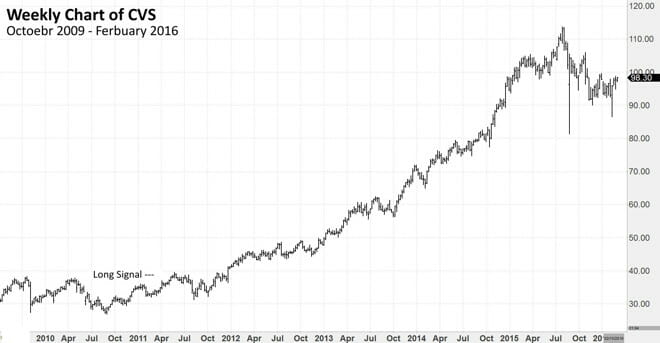
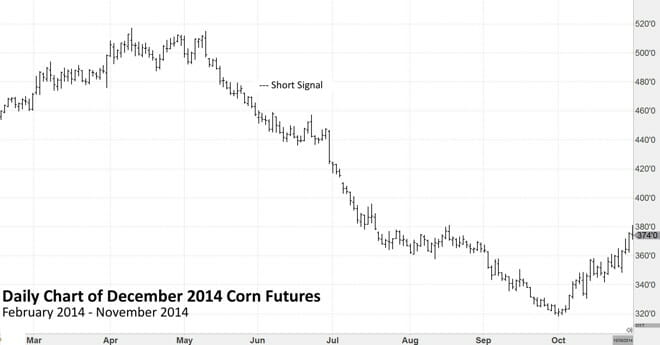
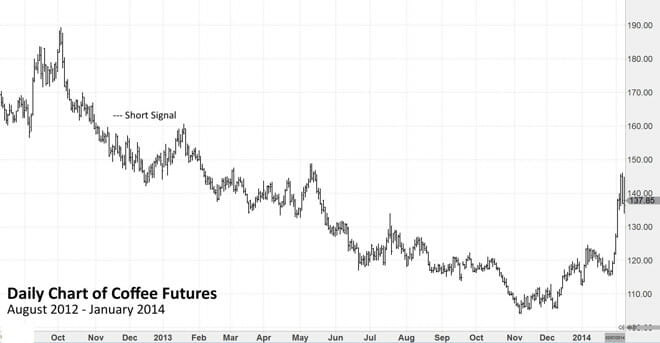
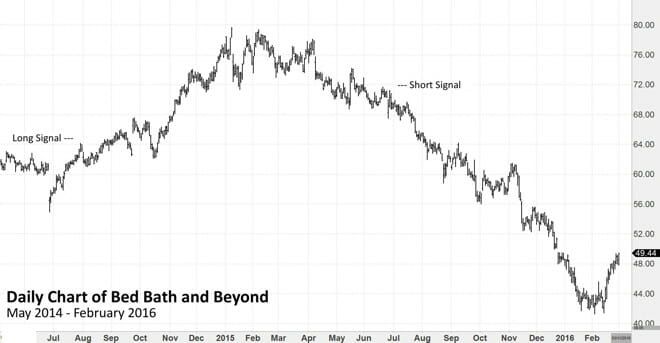
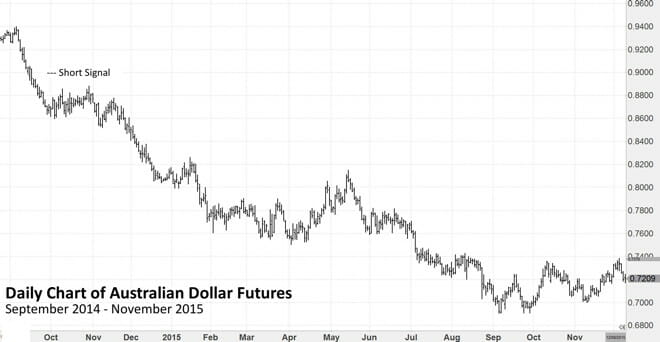
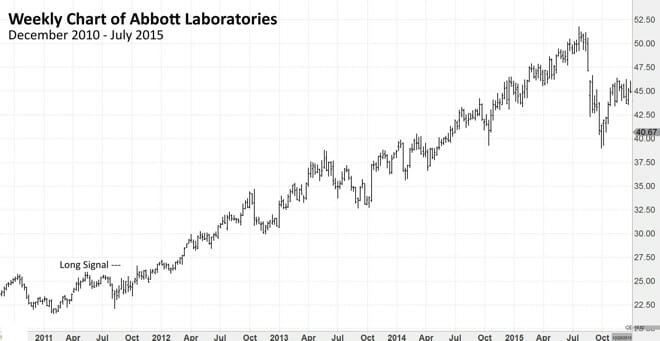
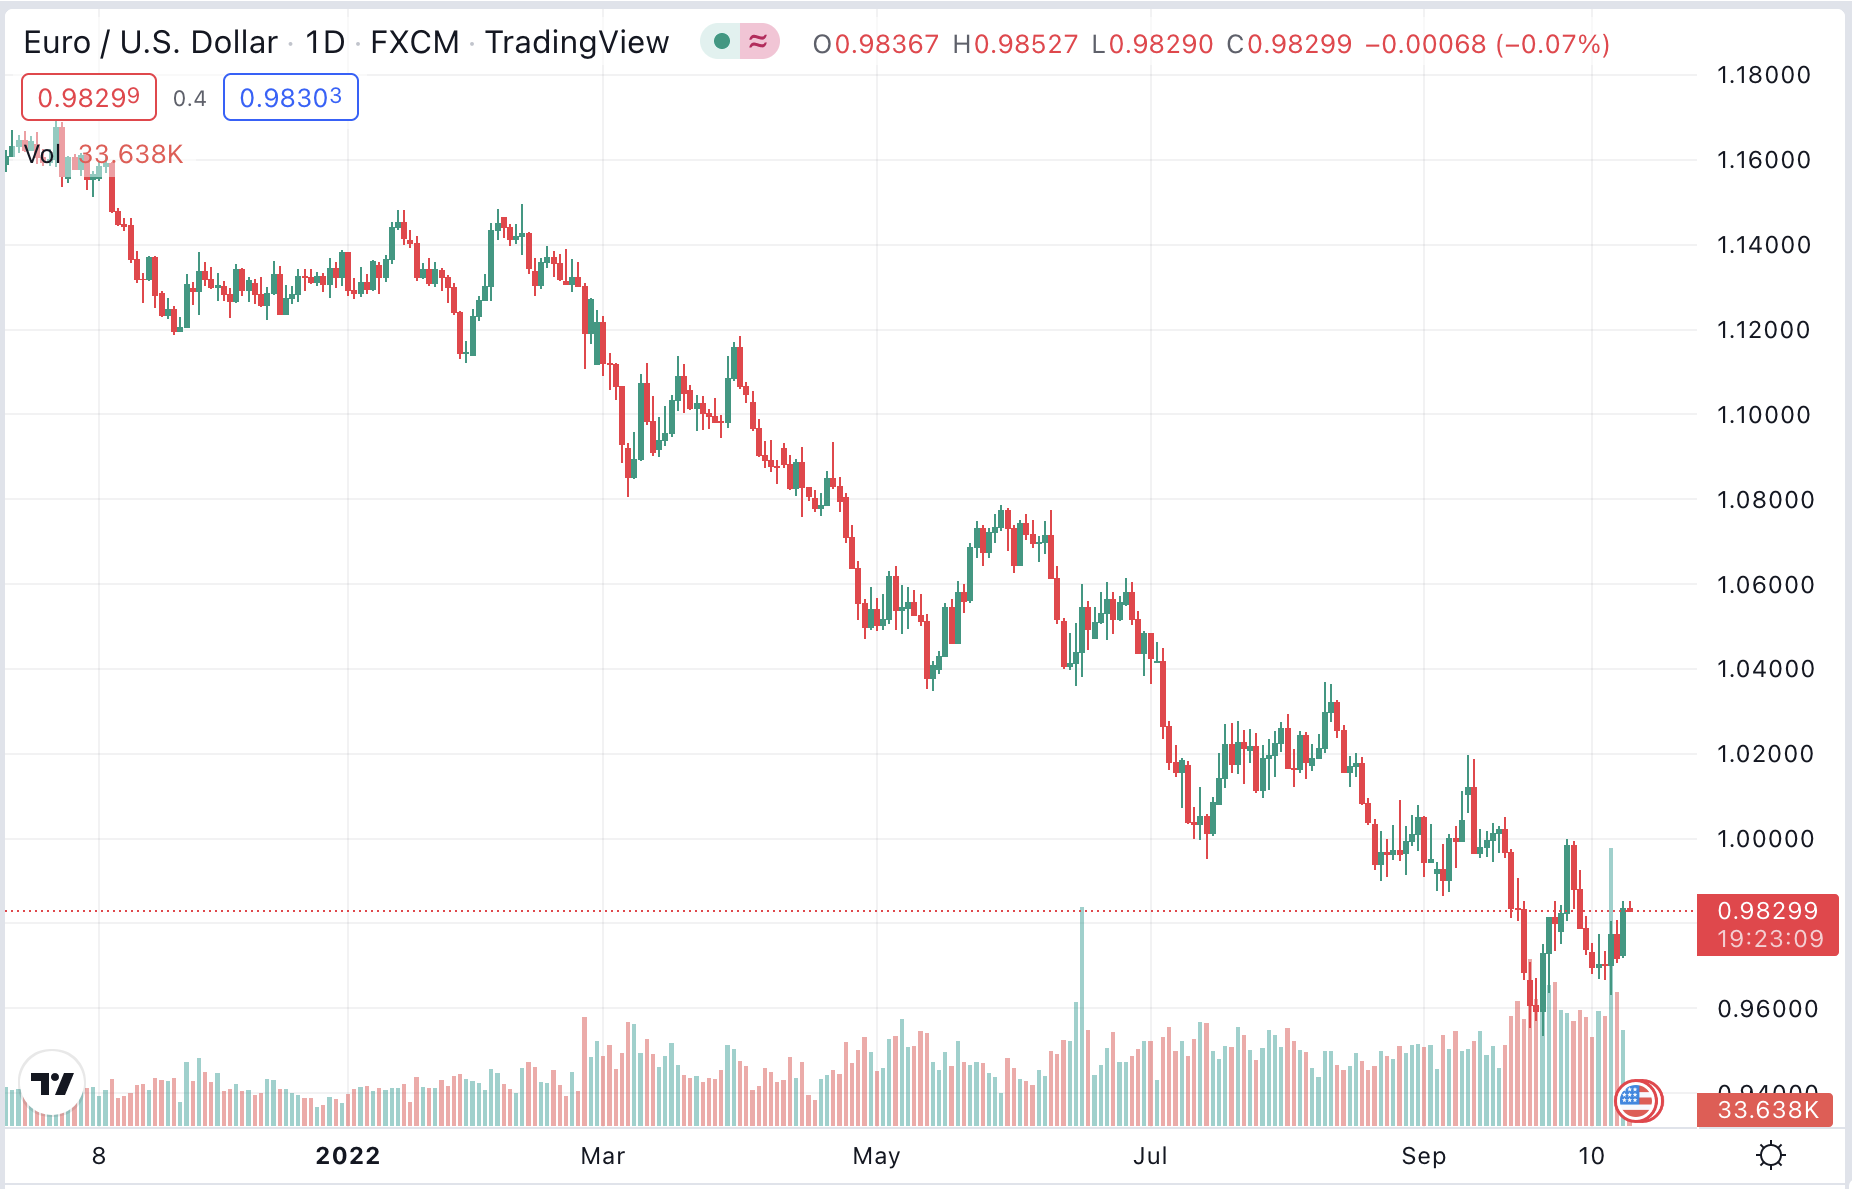
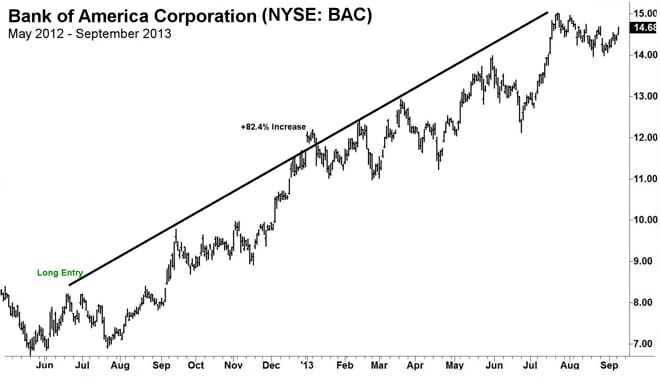
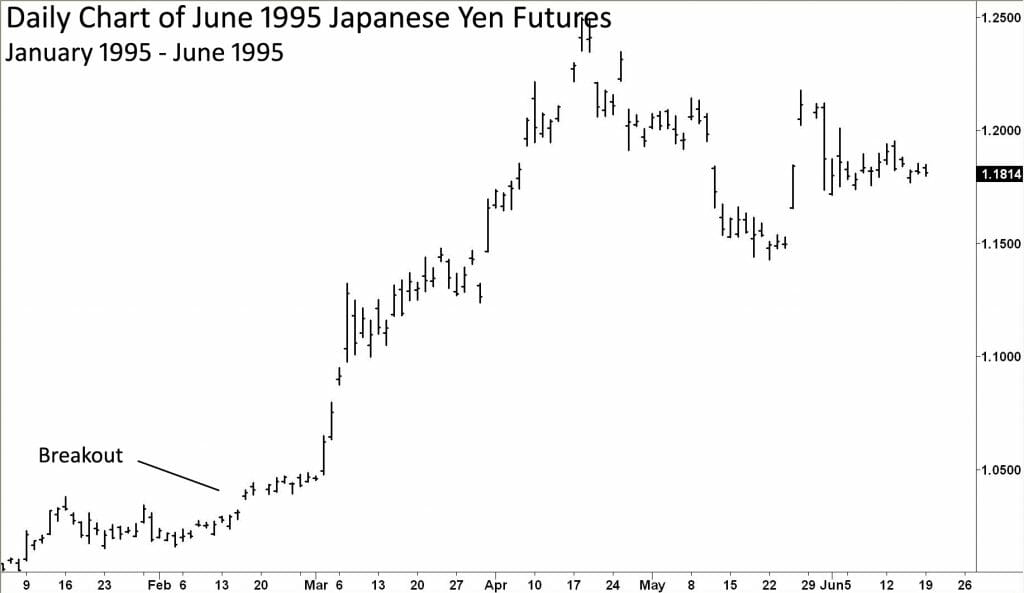
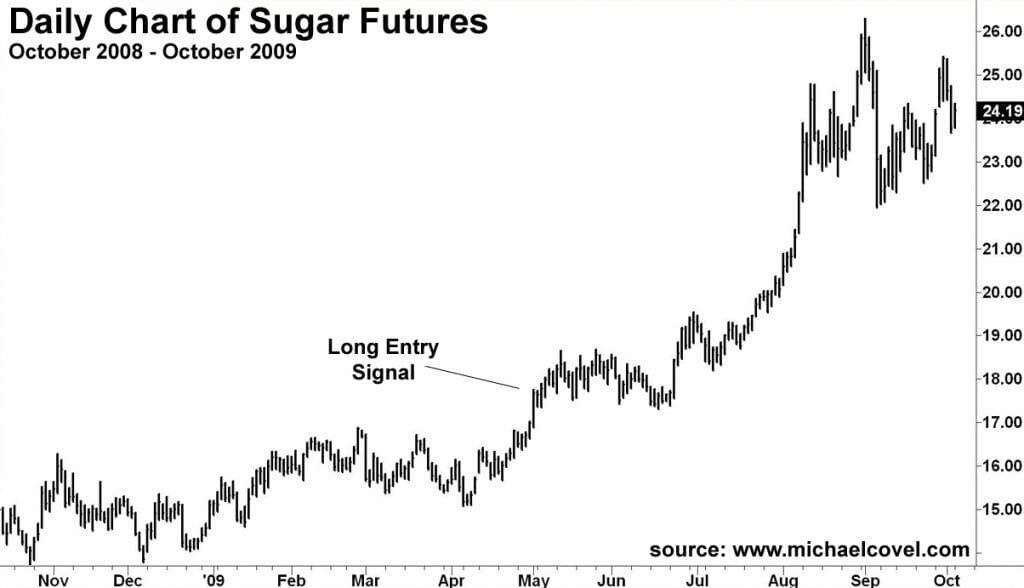
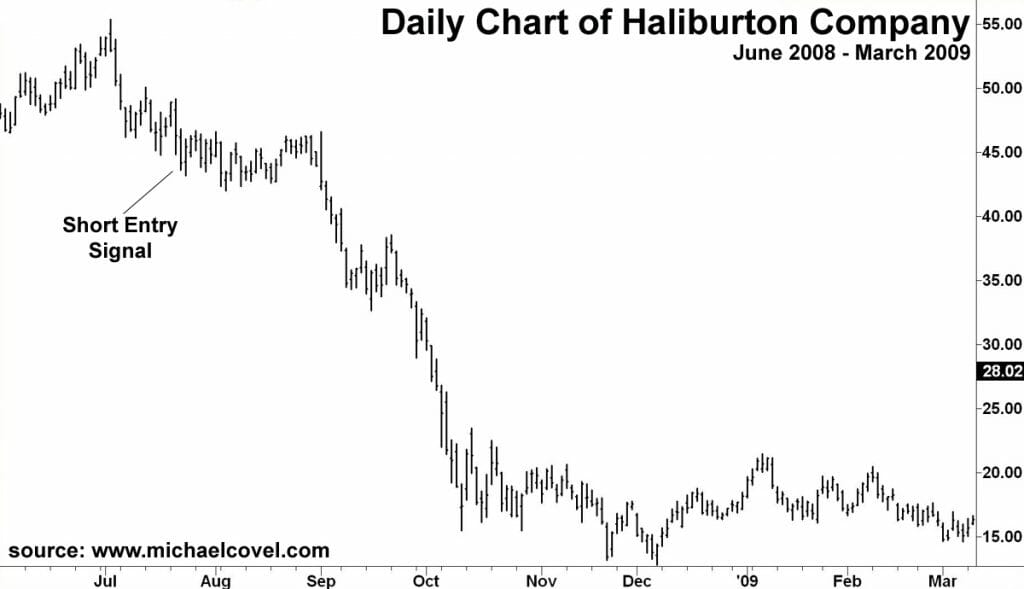
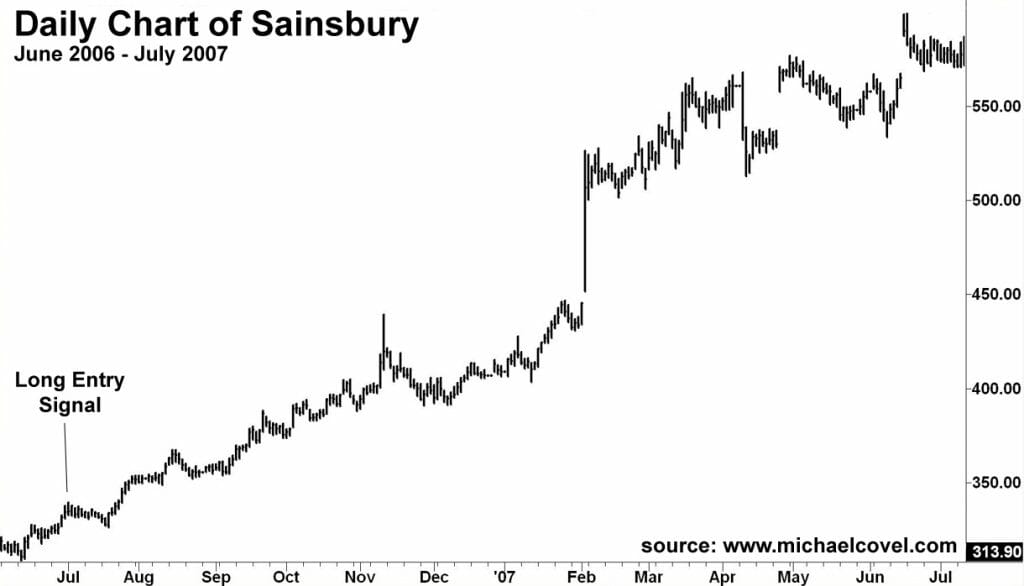
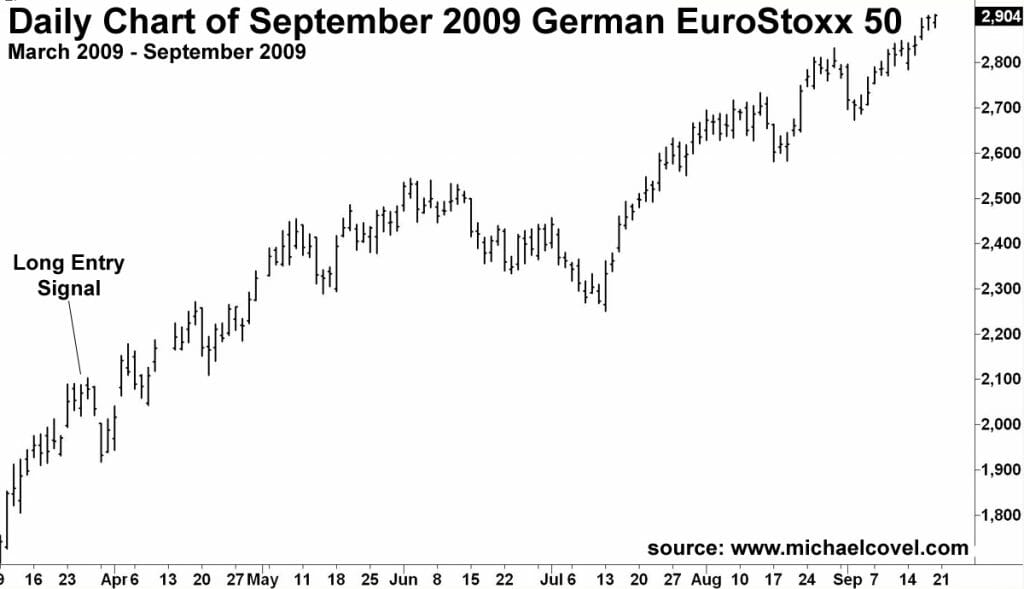
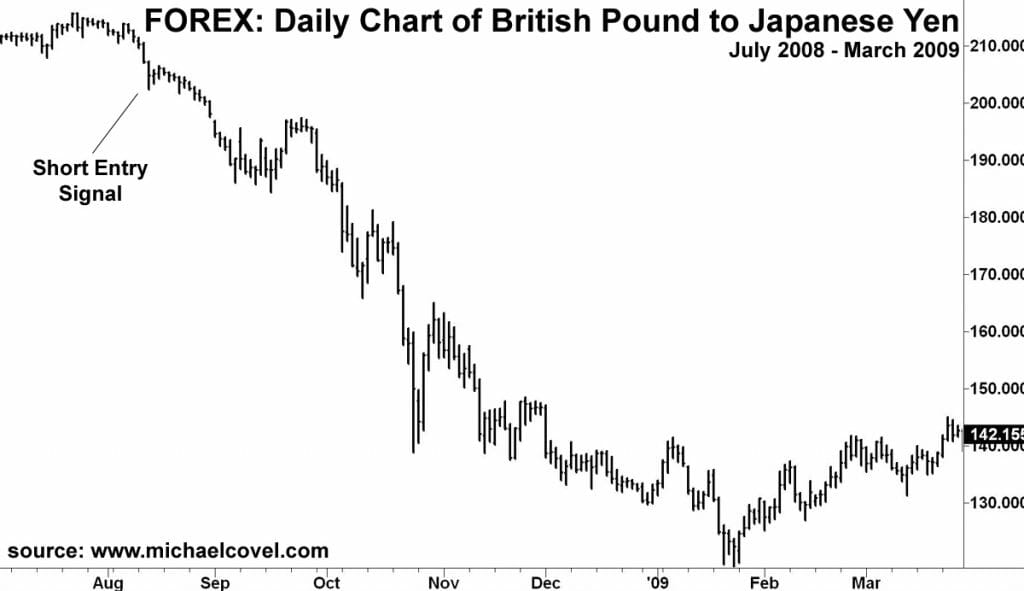
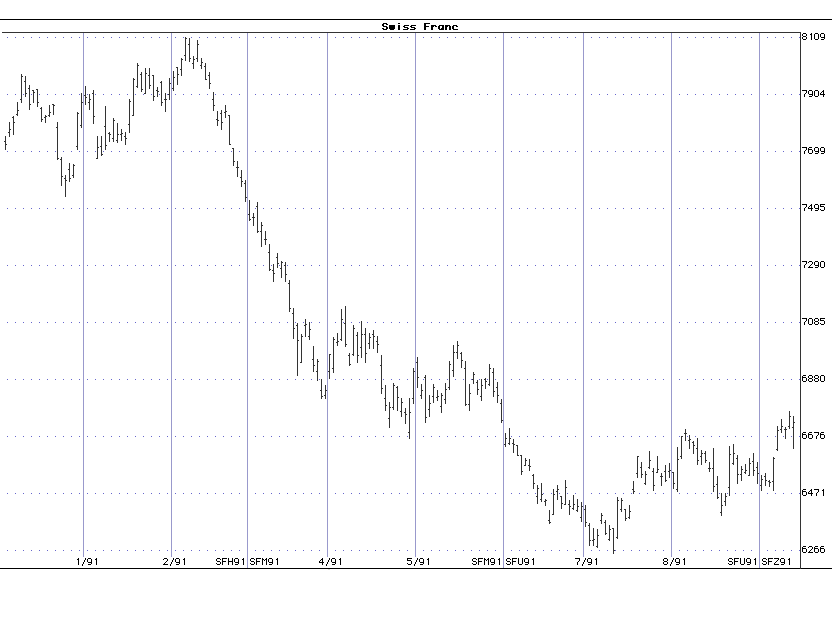
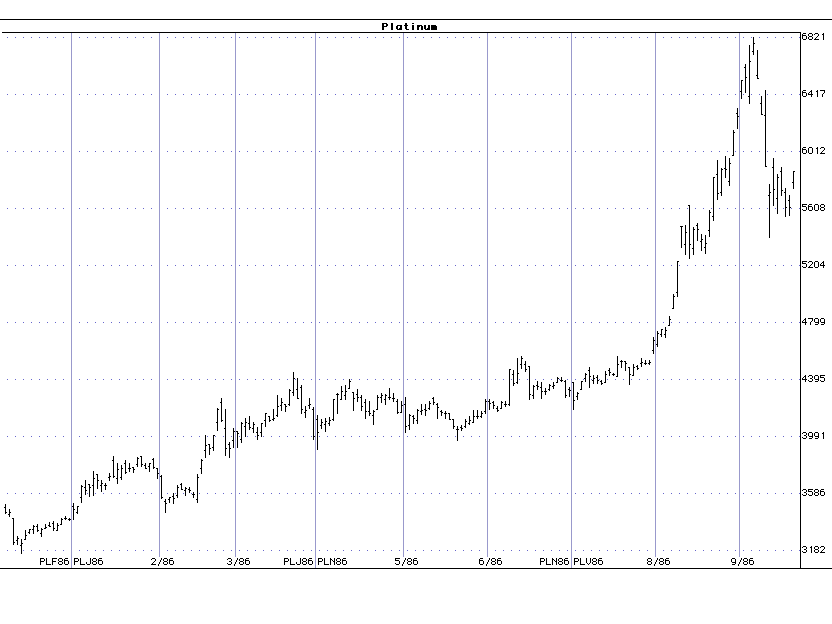
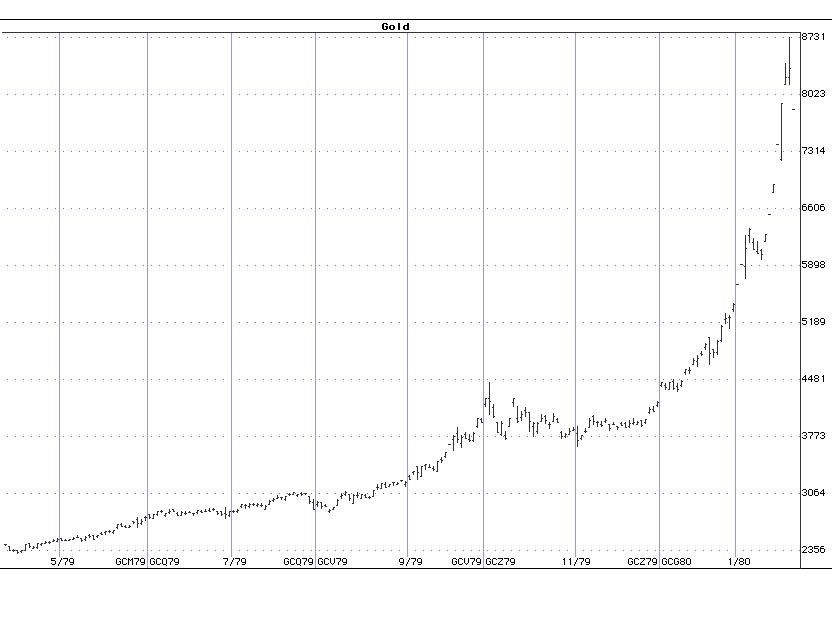
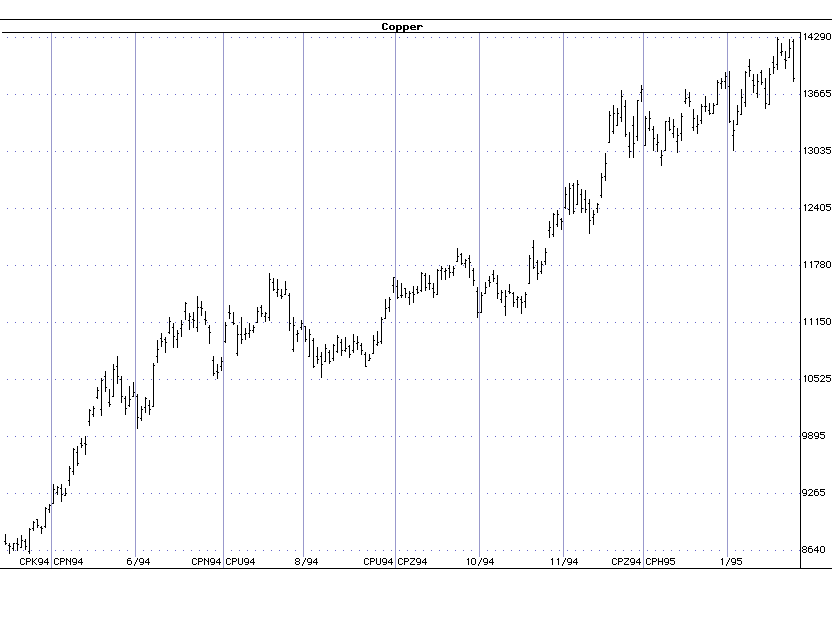
More trend following historical charts:
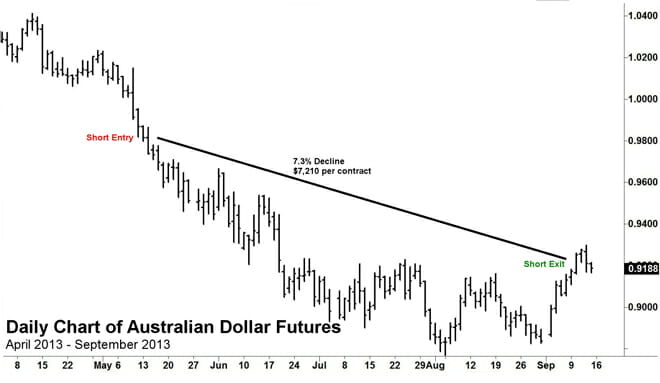
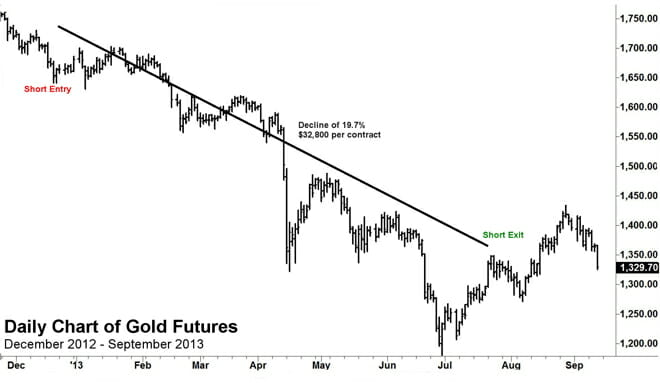
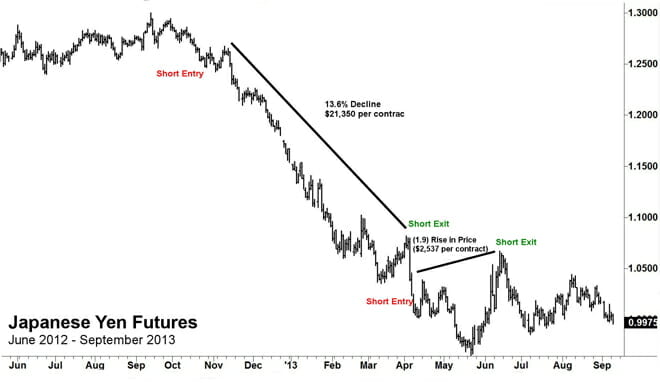
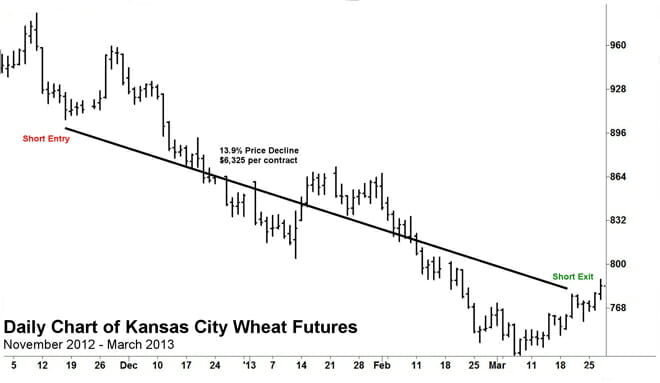
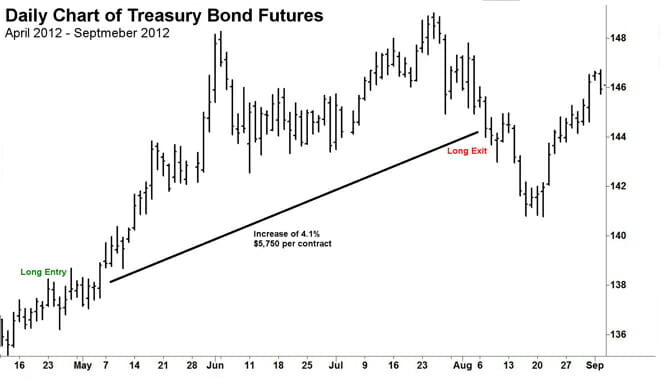
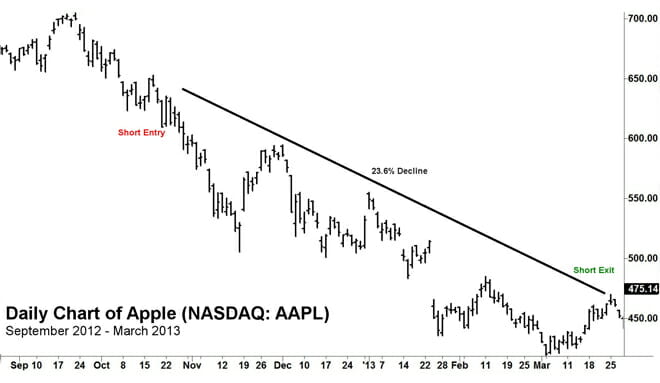
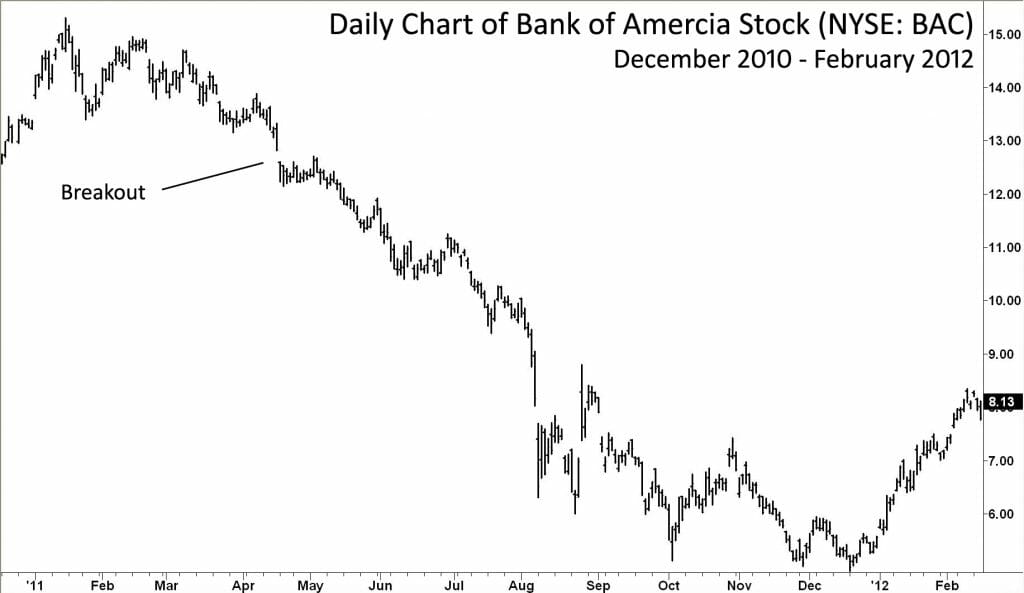
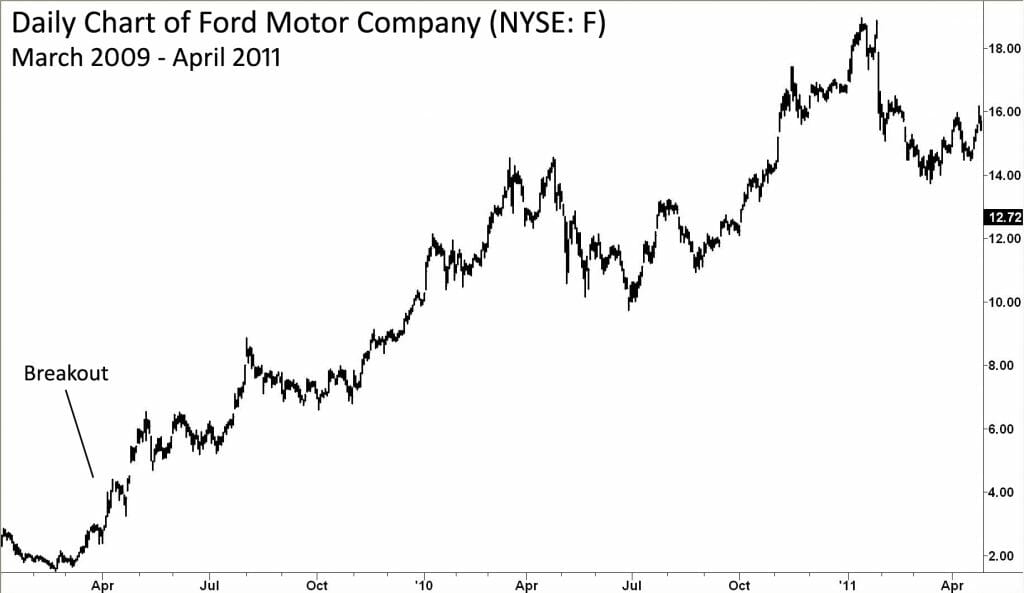
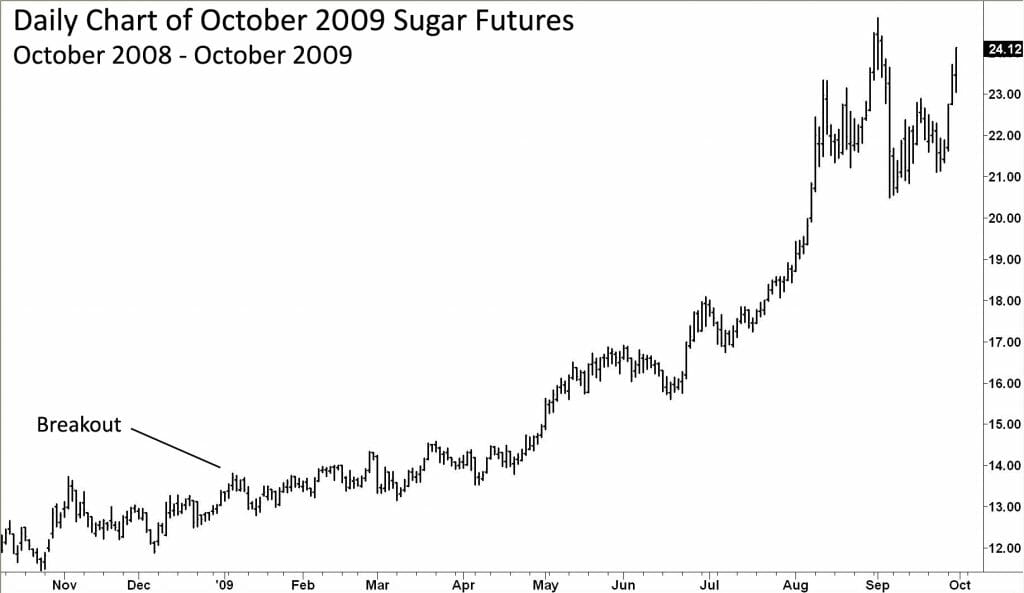
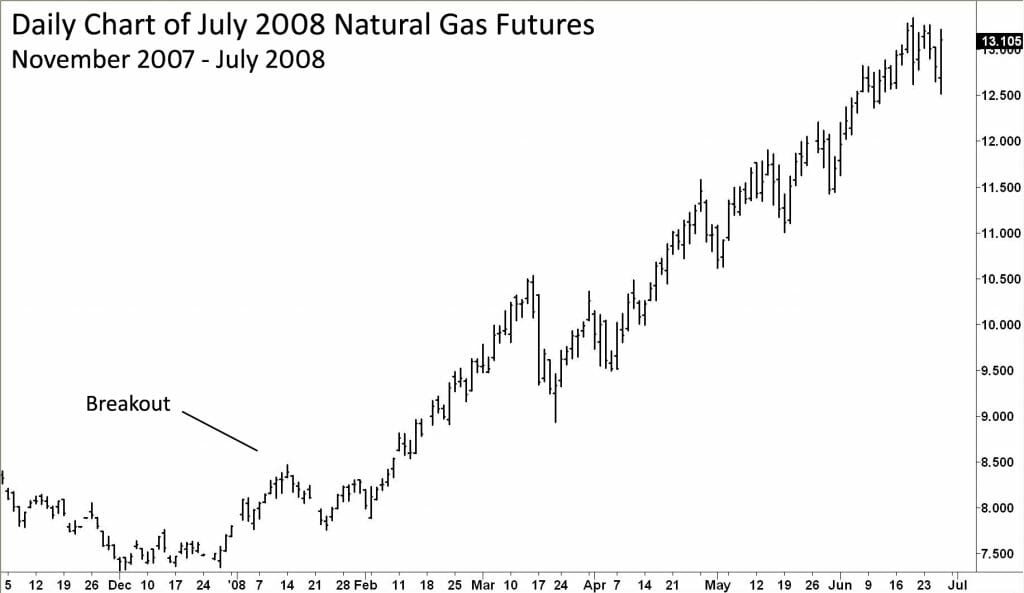
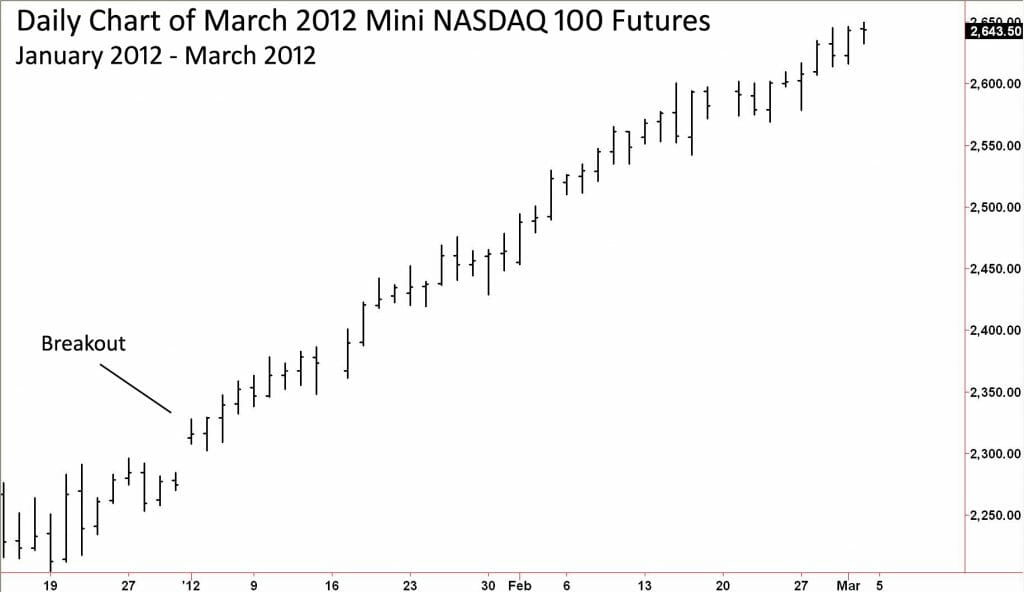
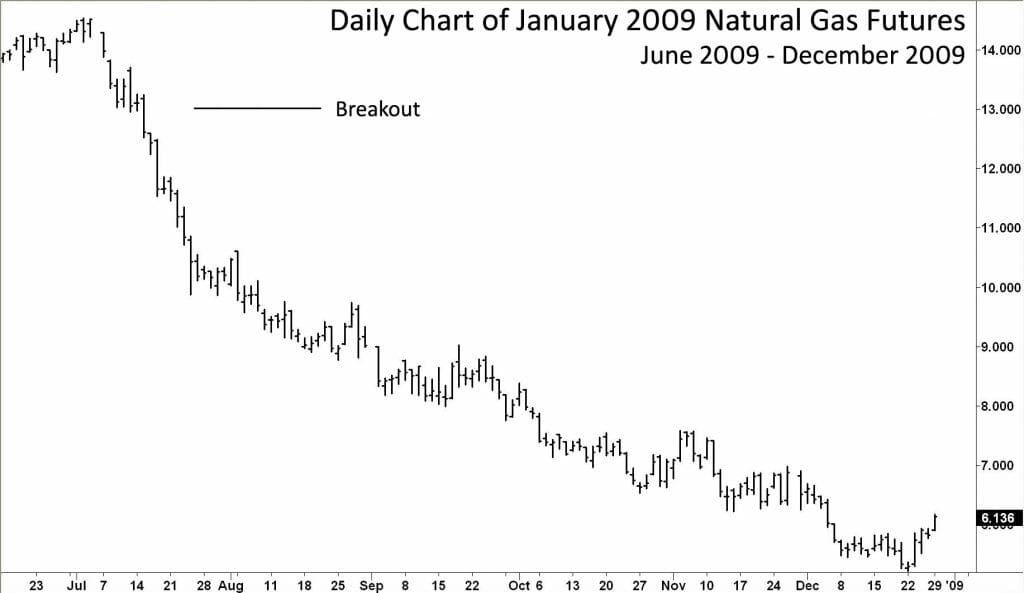
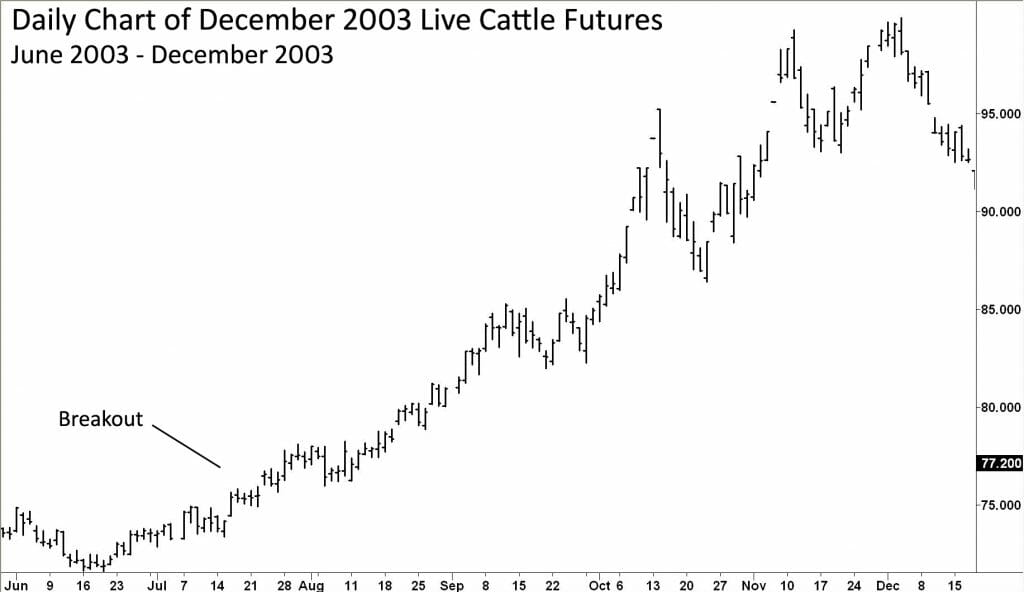
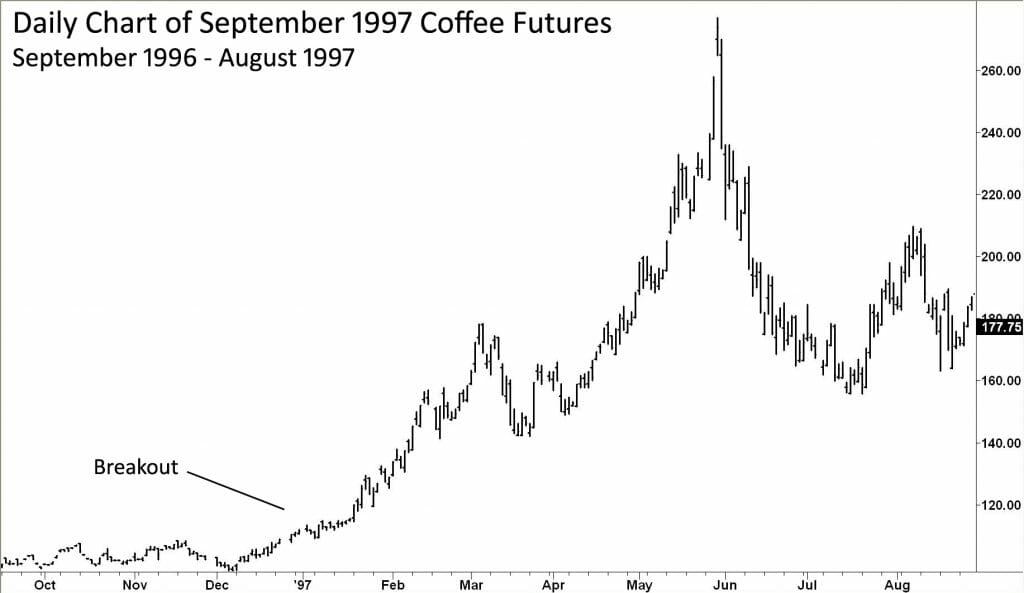
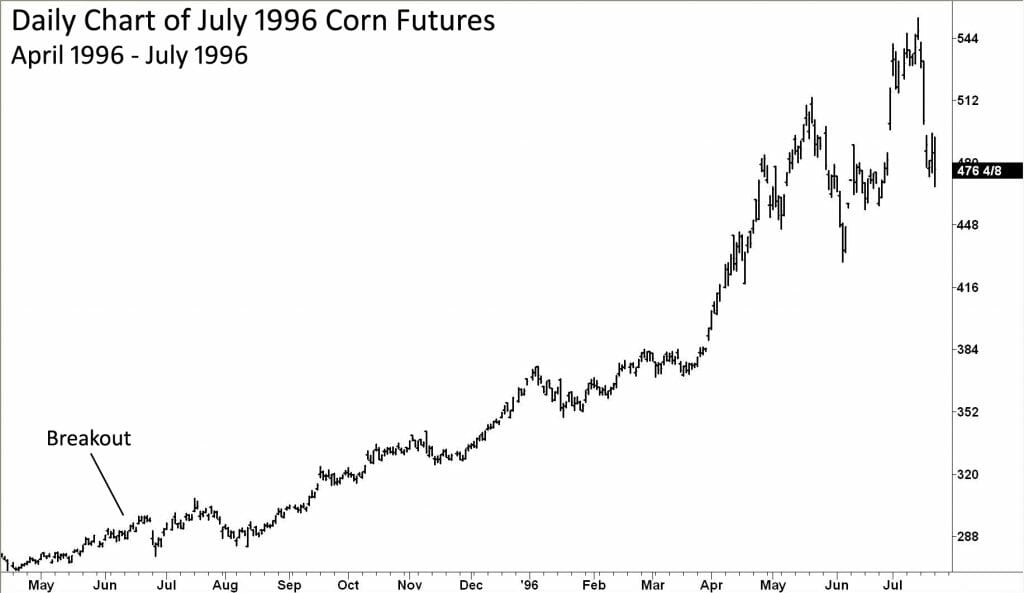
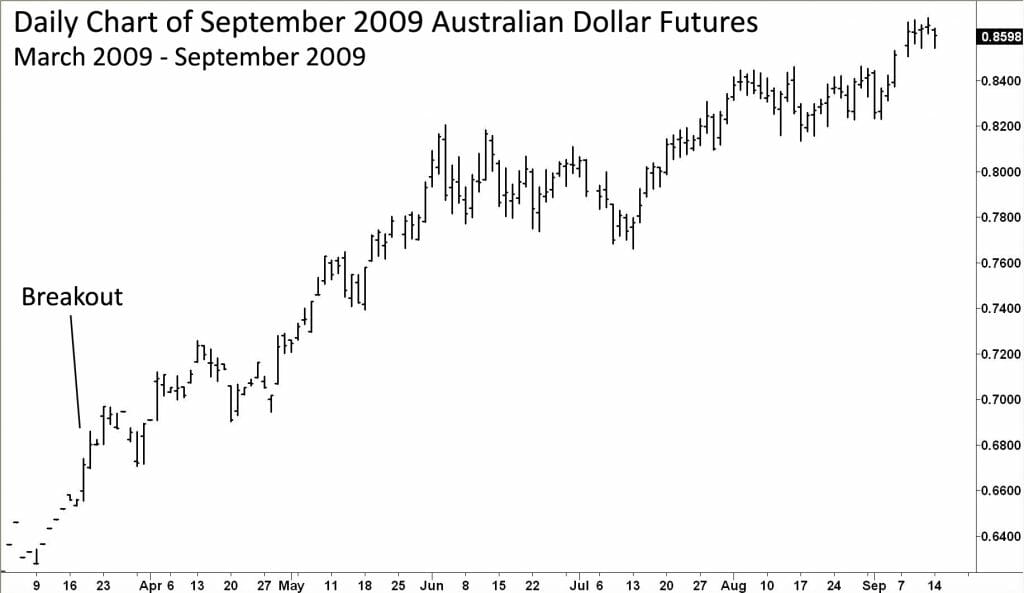
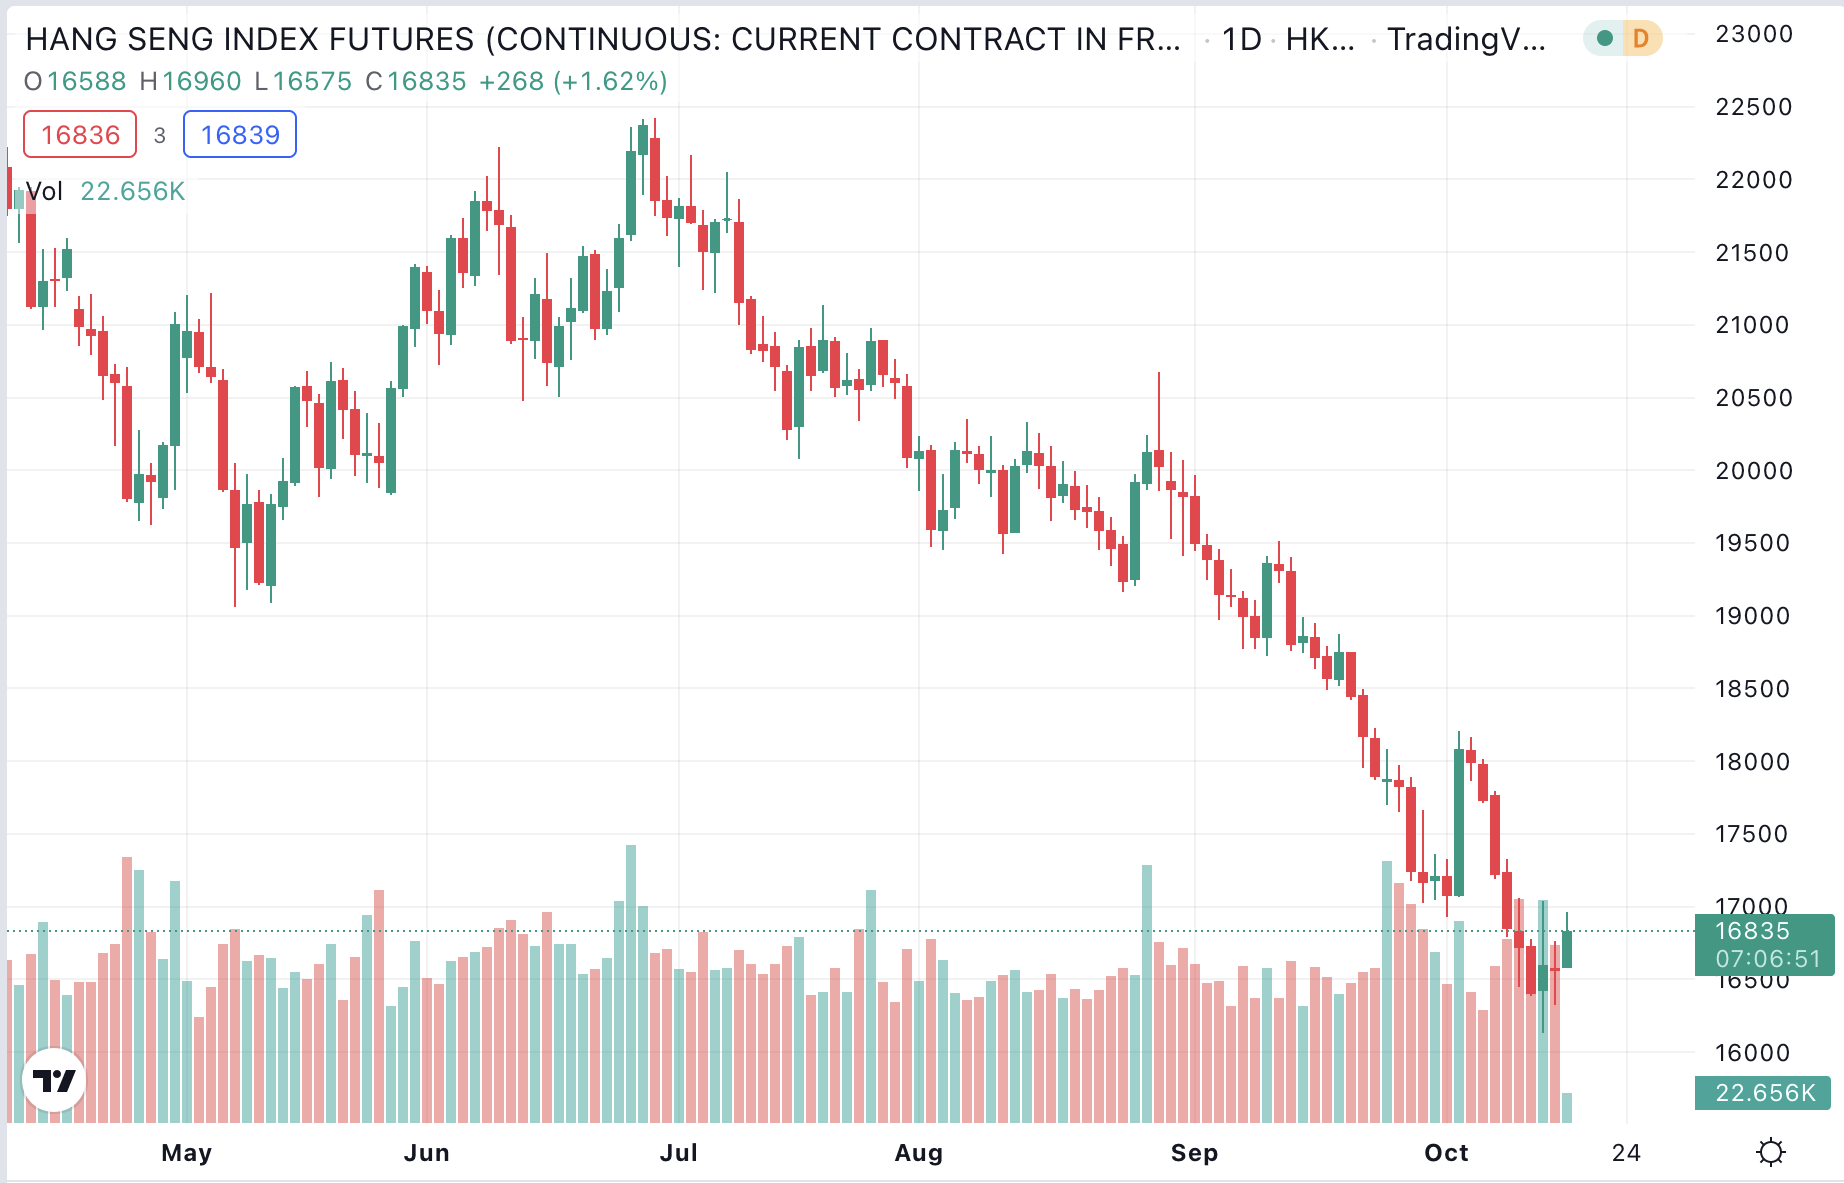
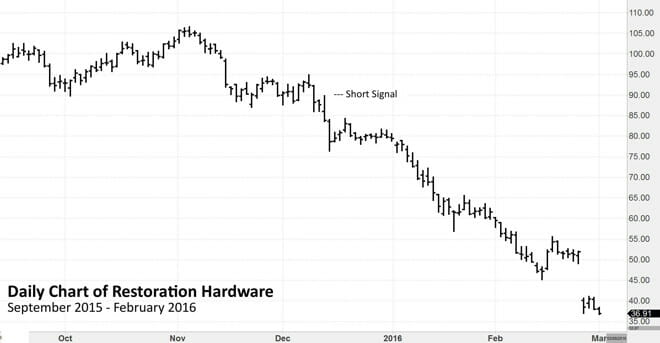
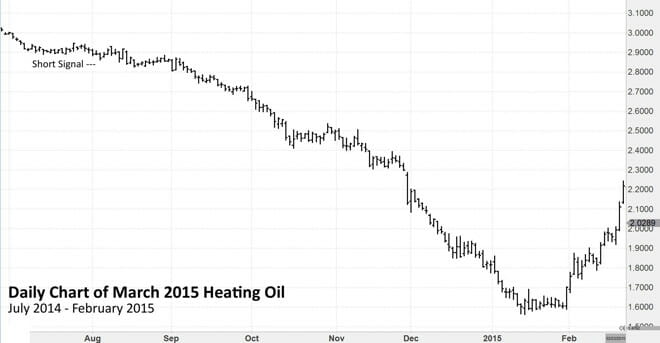
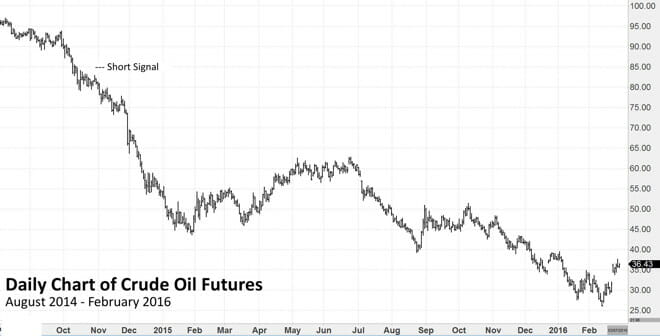
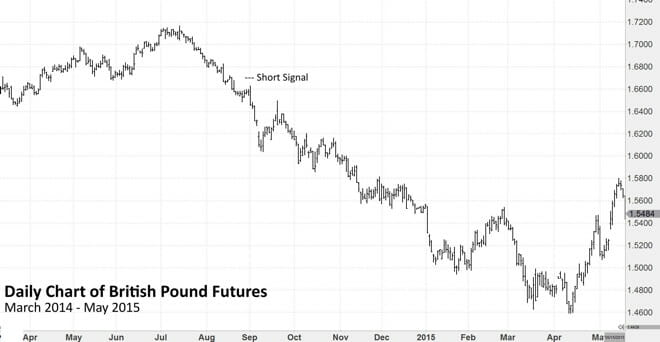
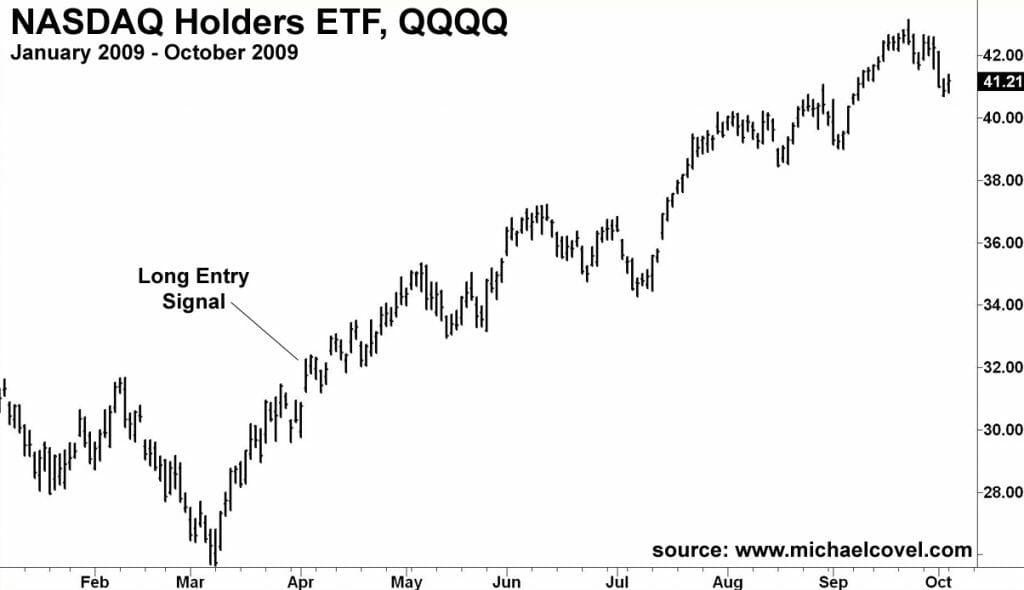
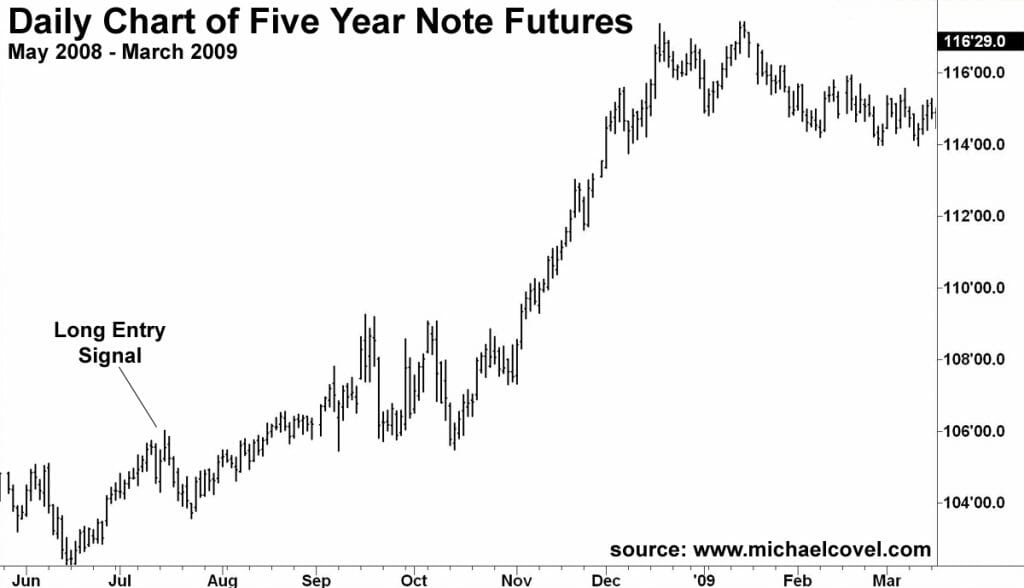
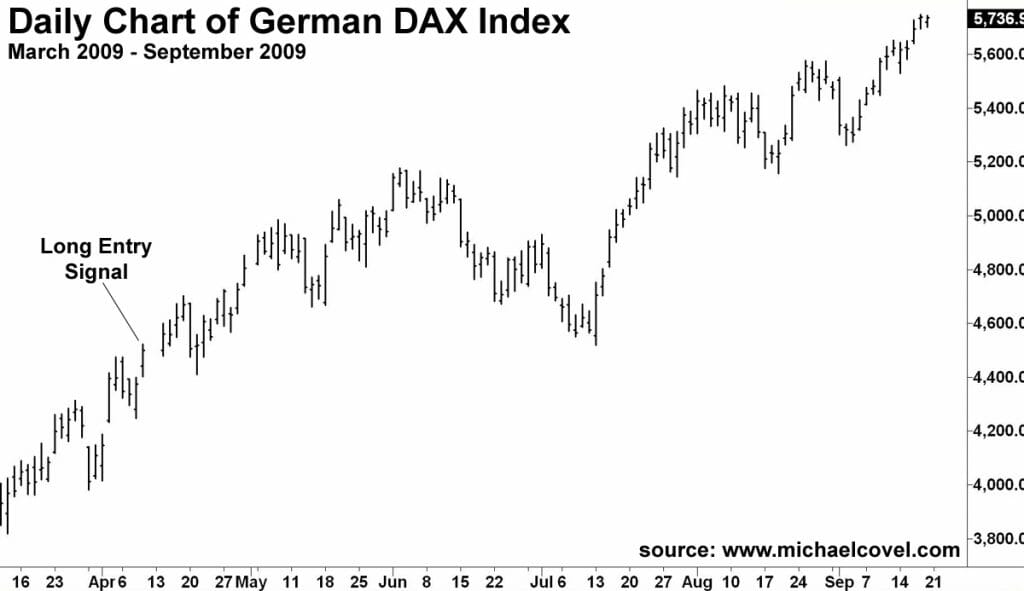
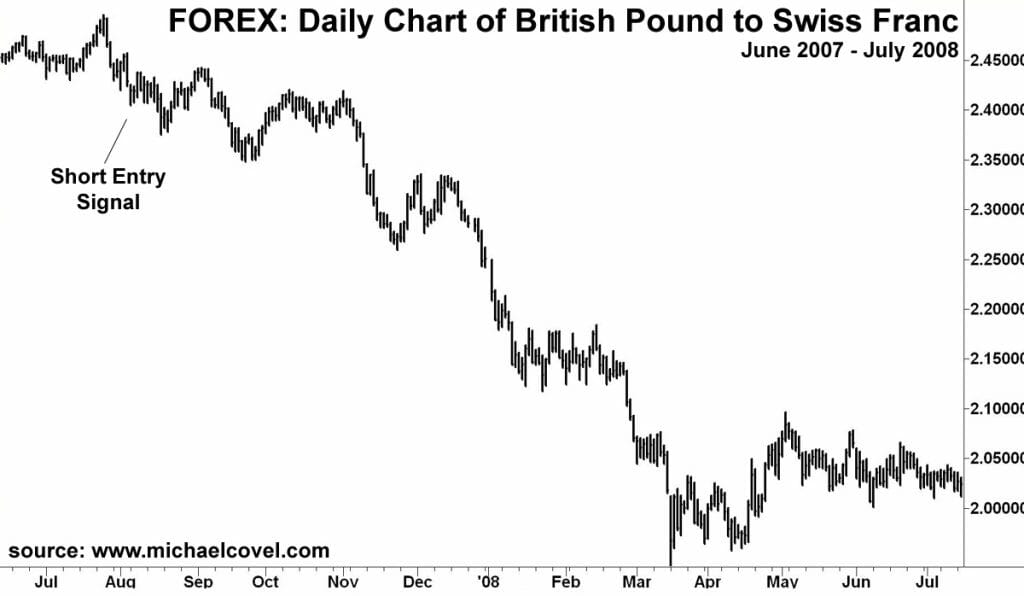
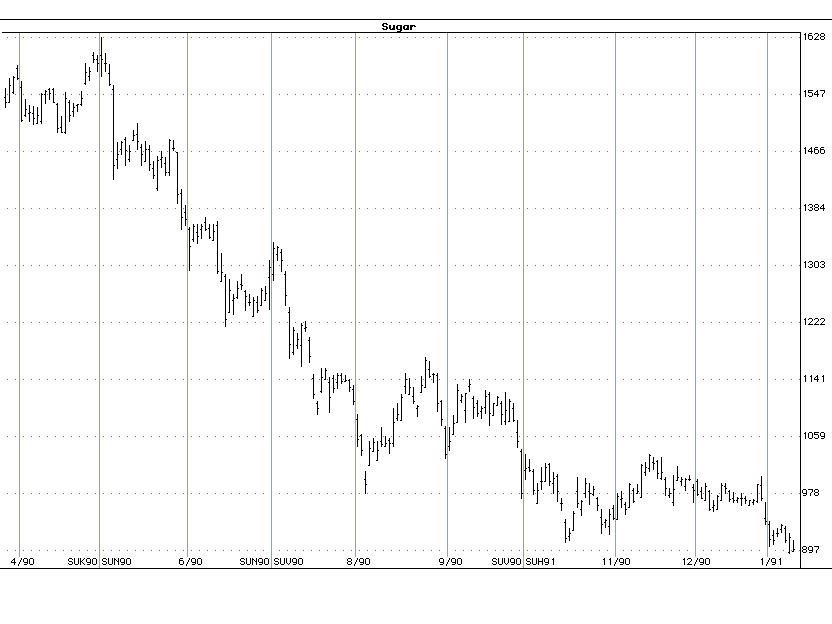
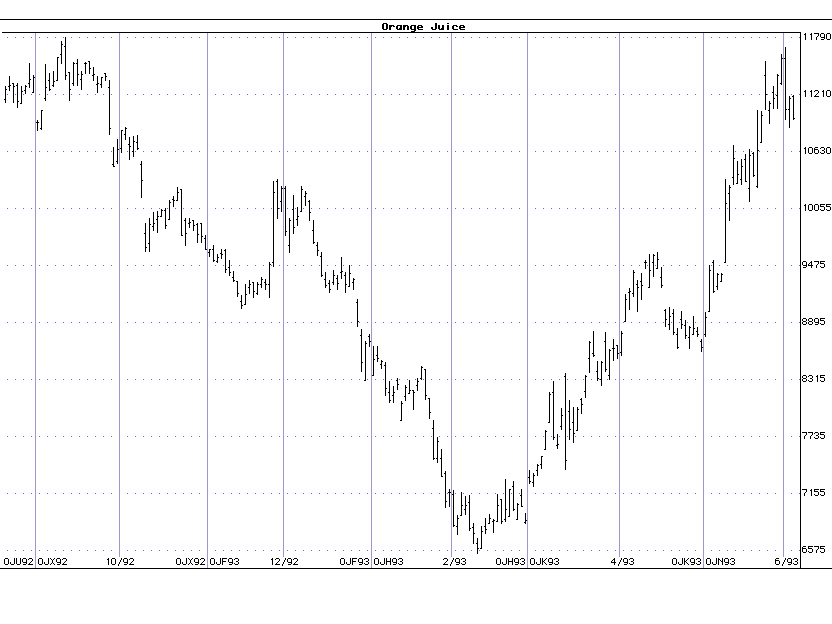
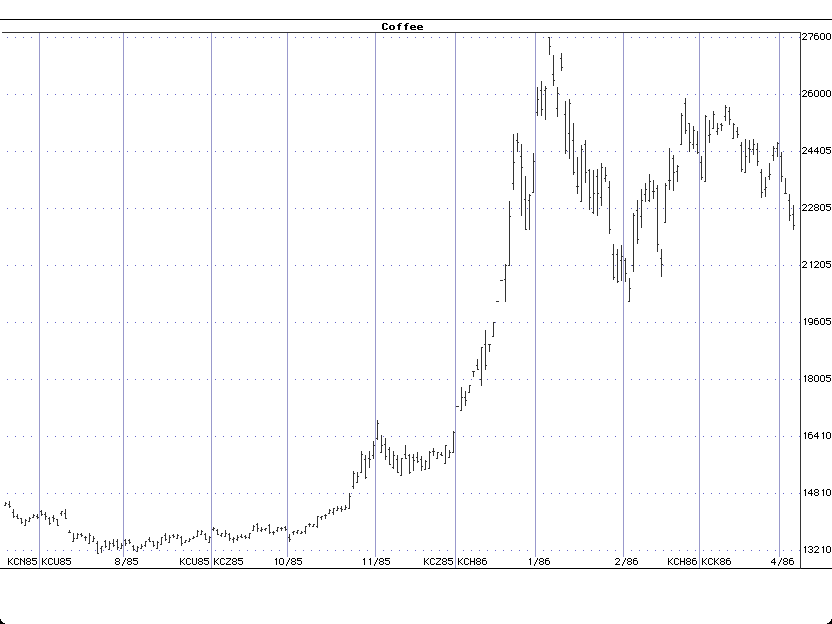
More trend following historical charts:
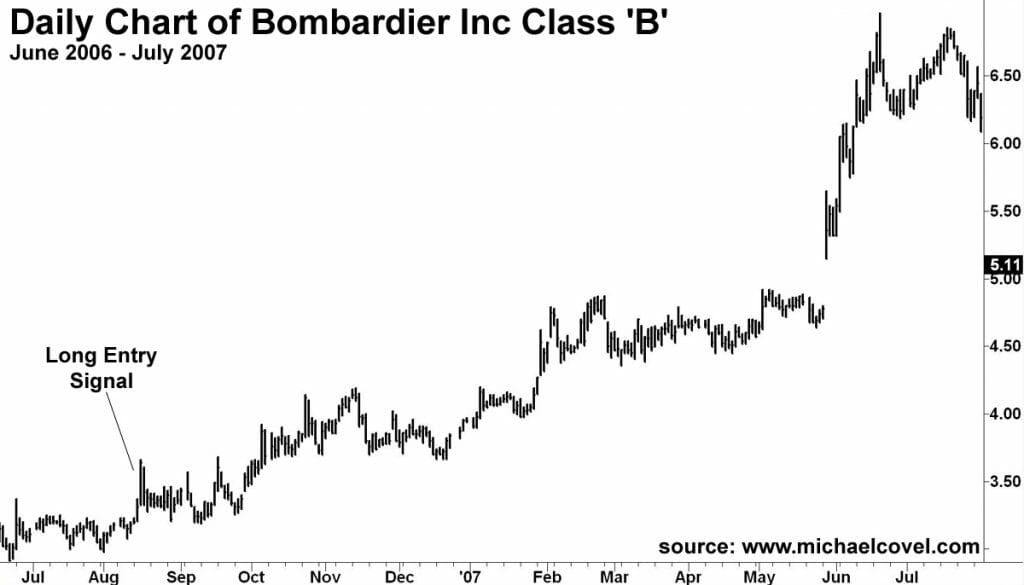
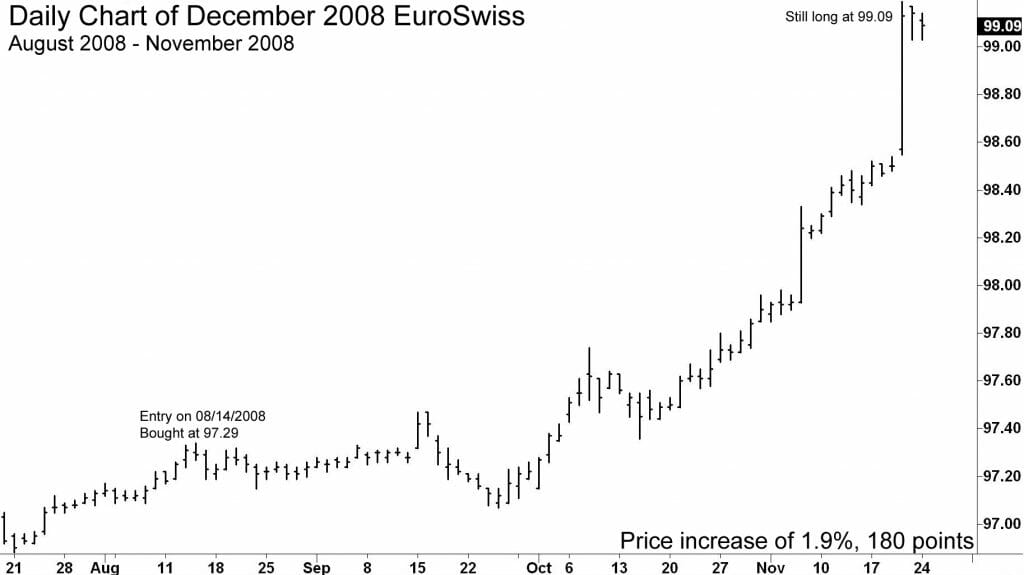
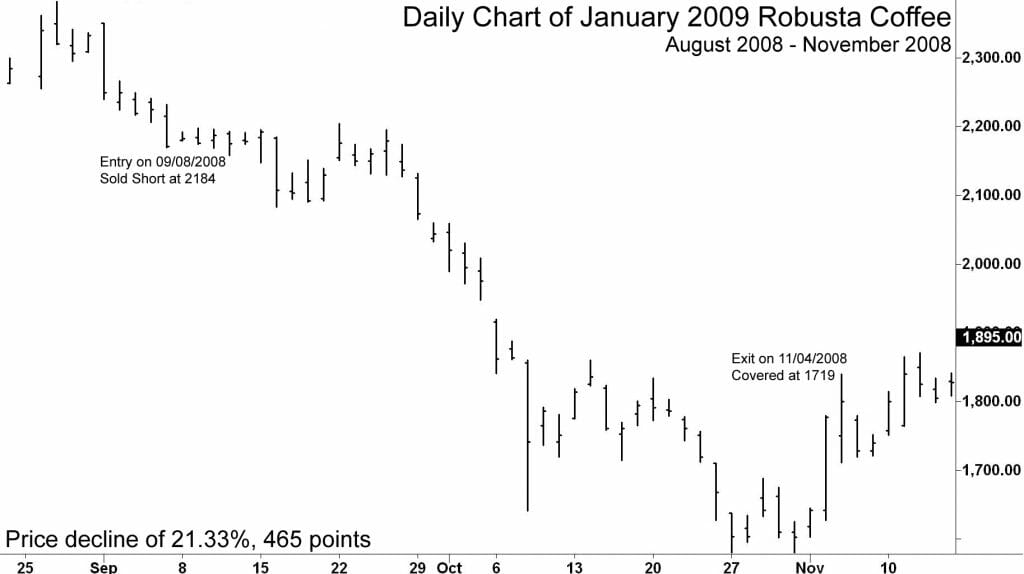
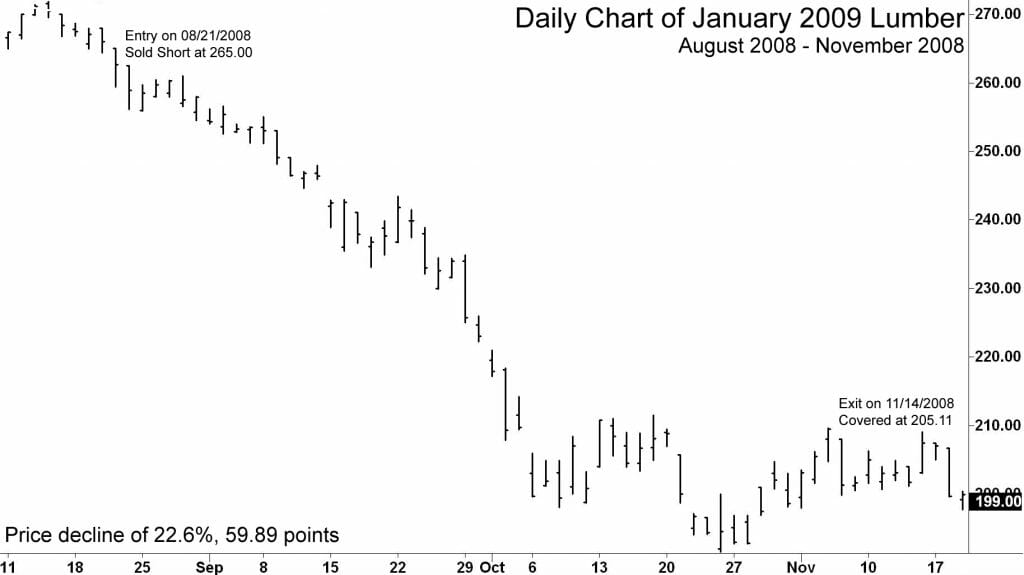
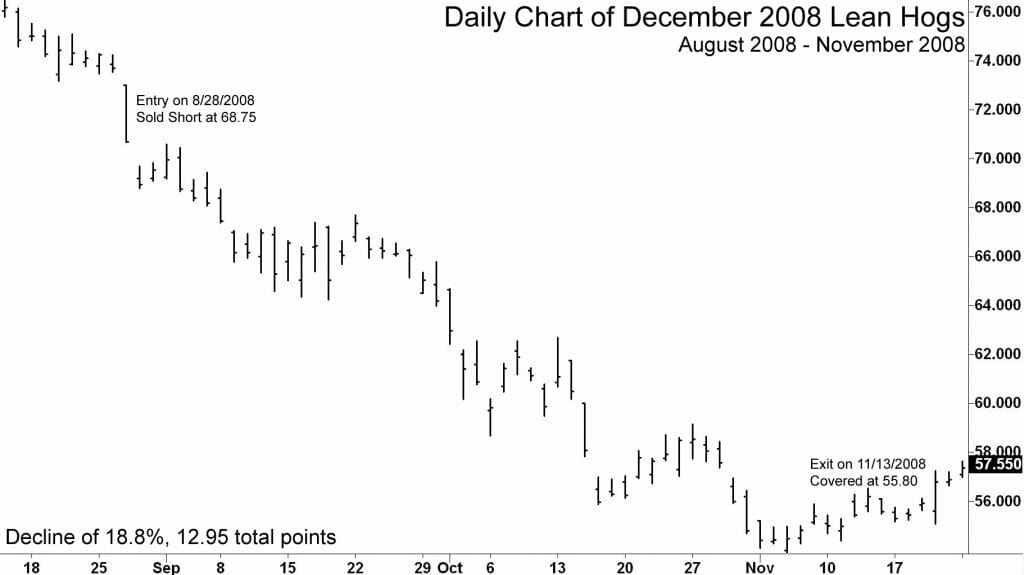
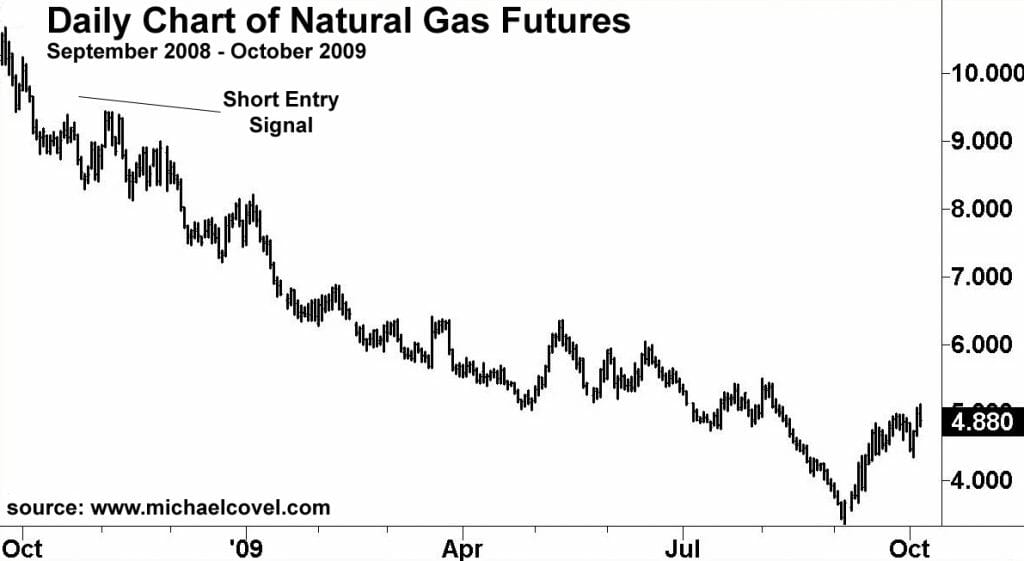
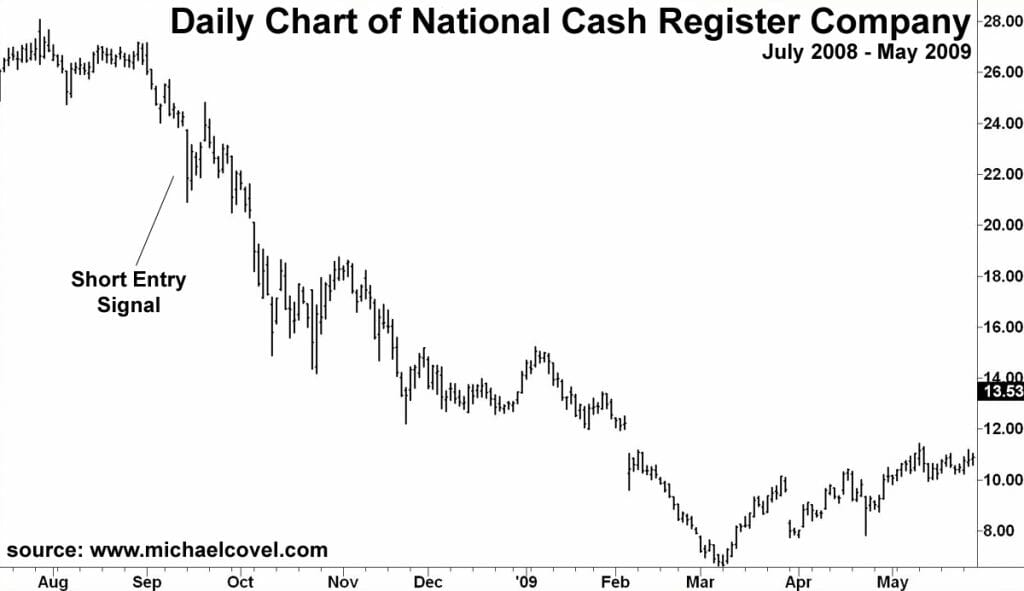
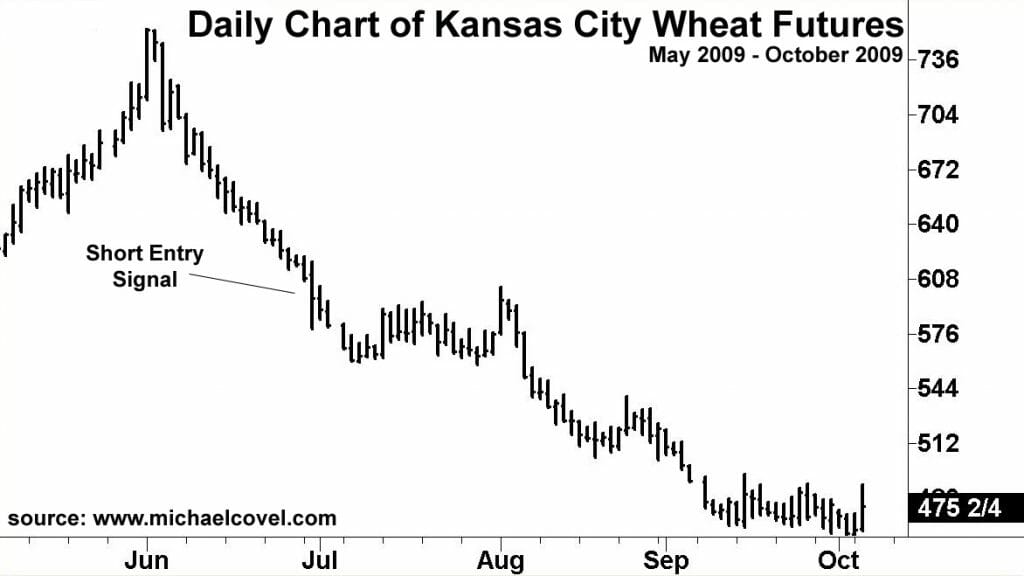
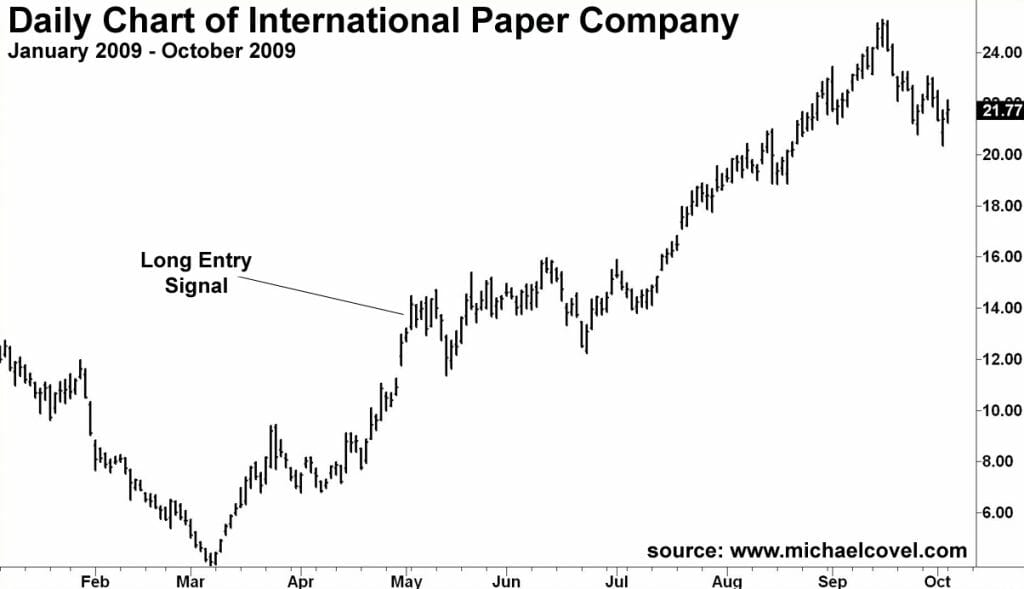
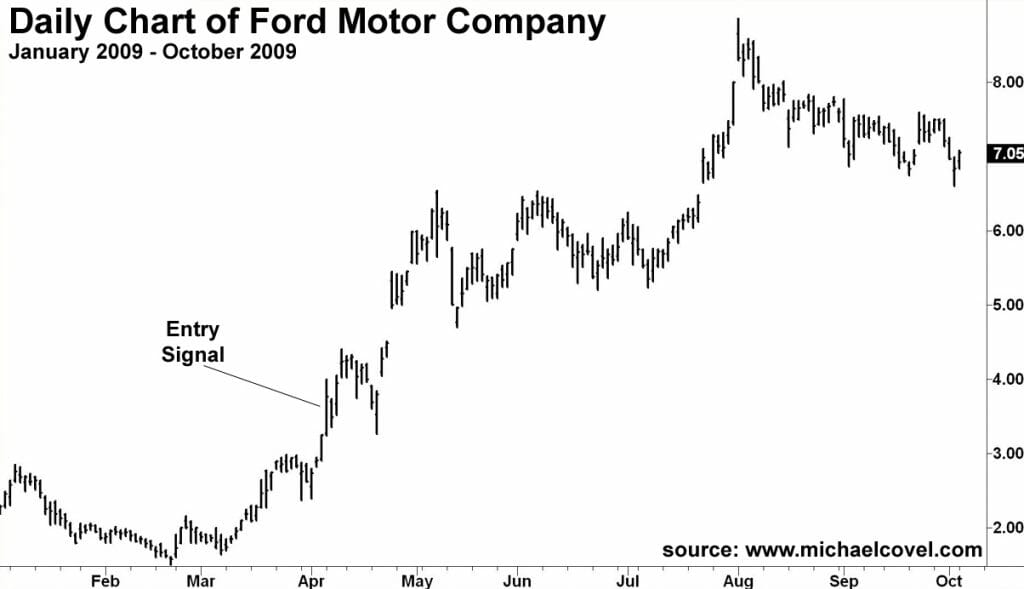
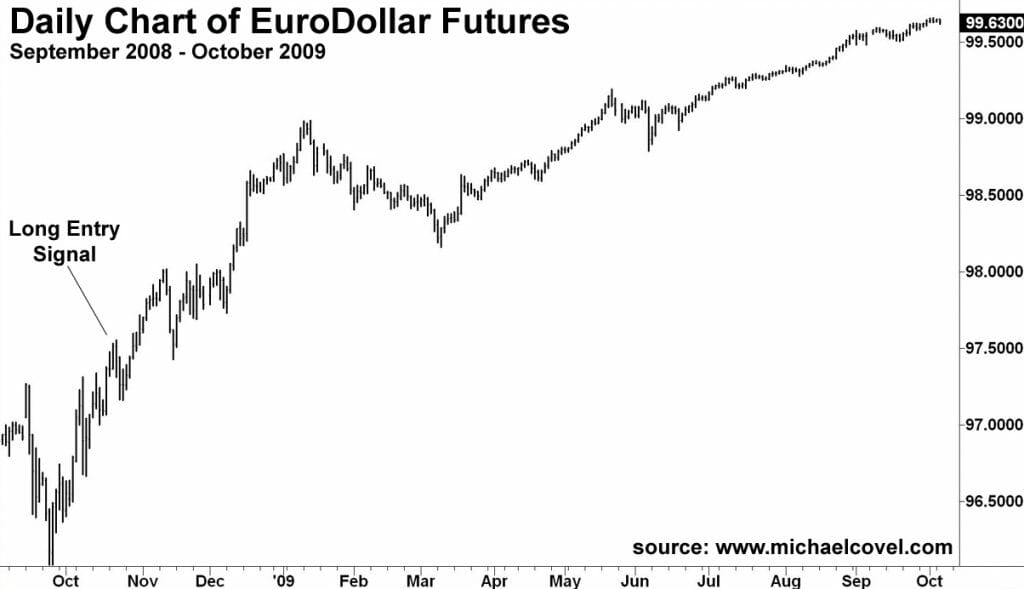
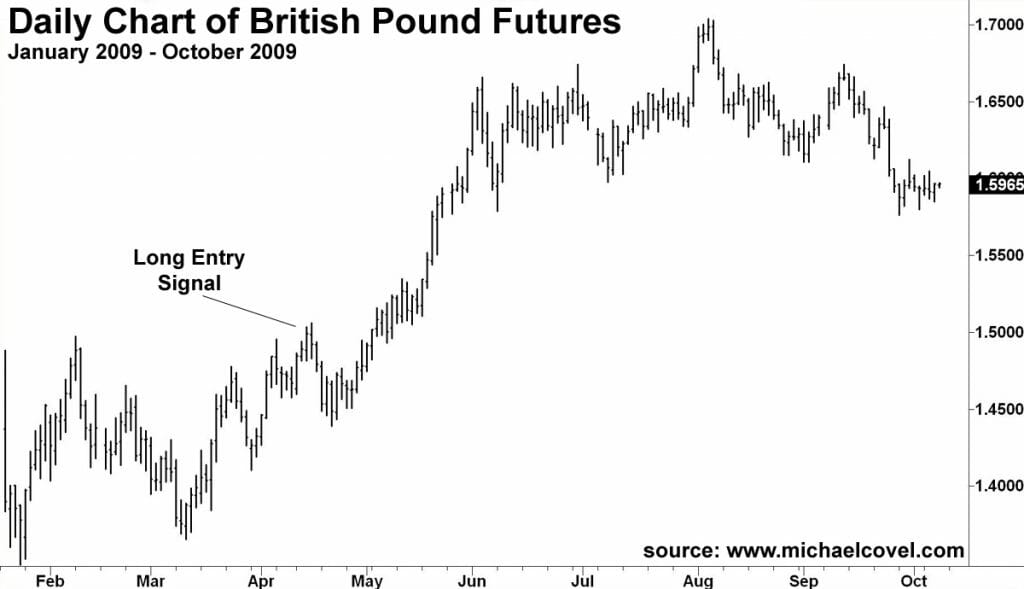
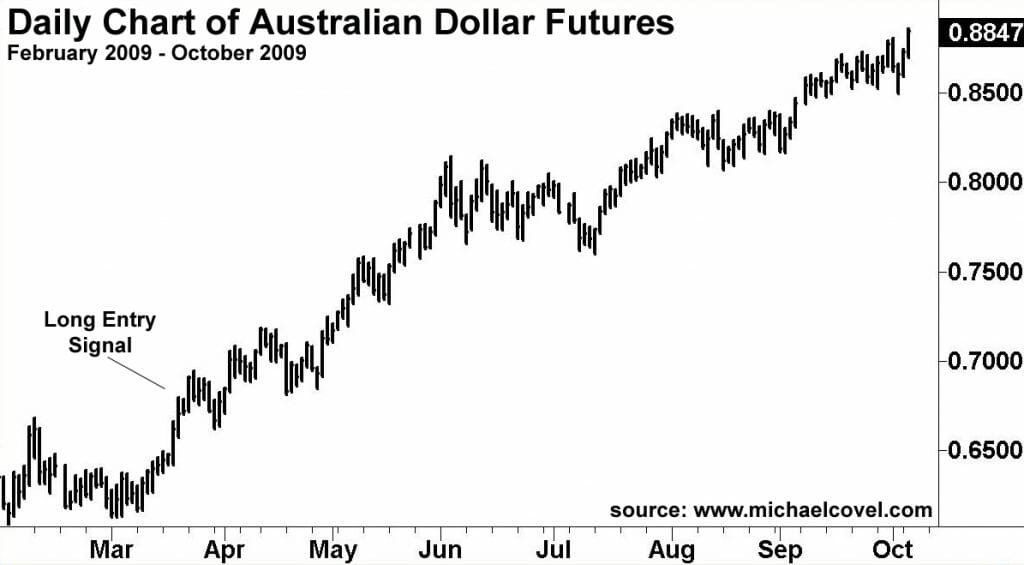
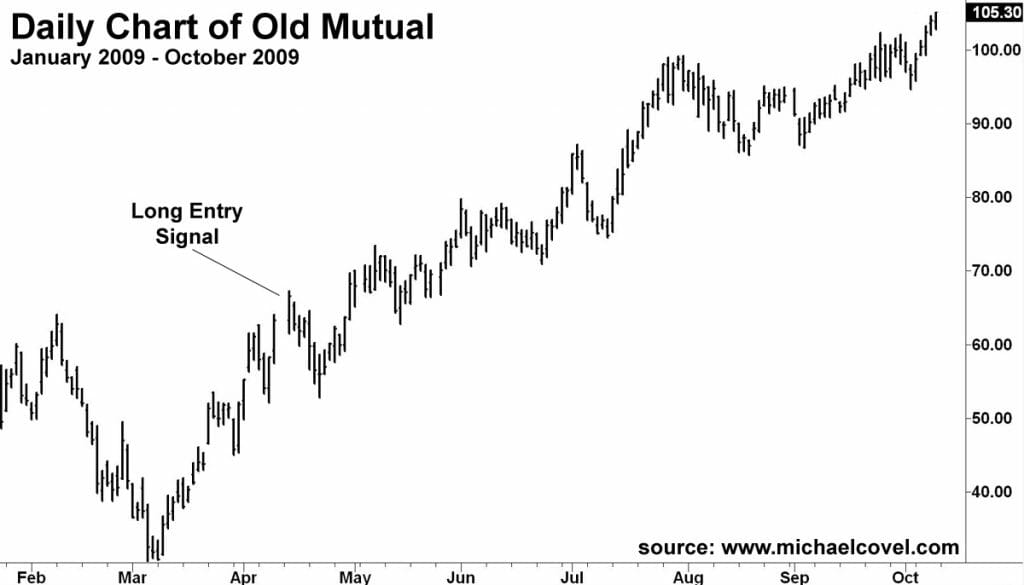
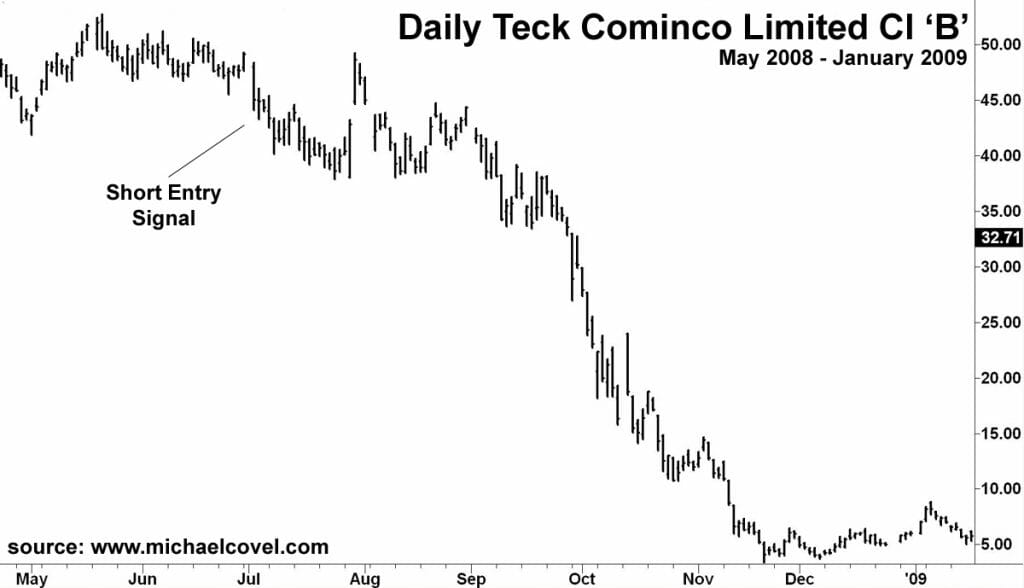
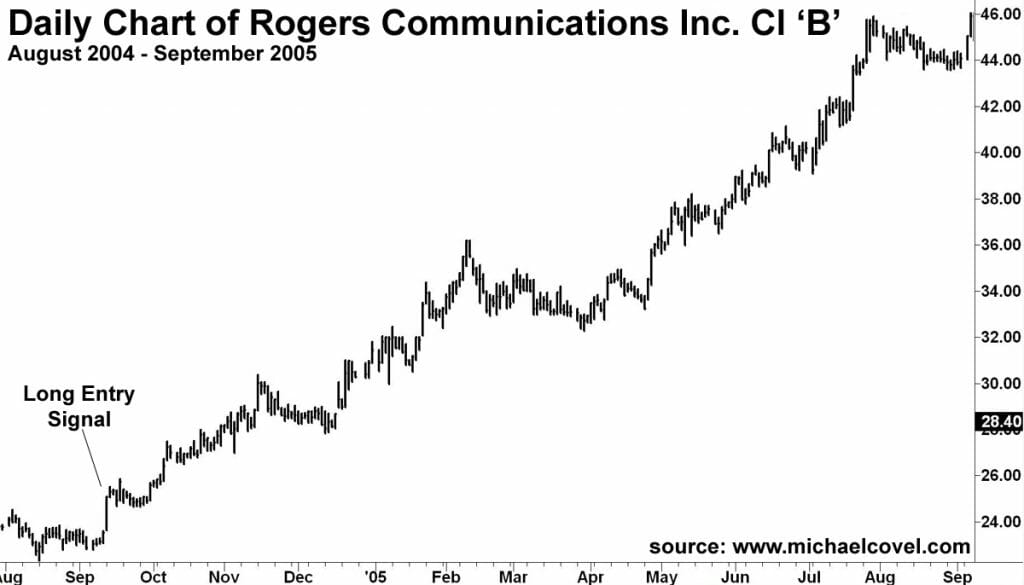
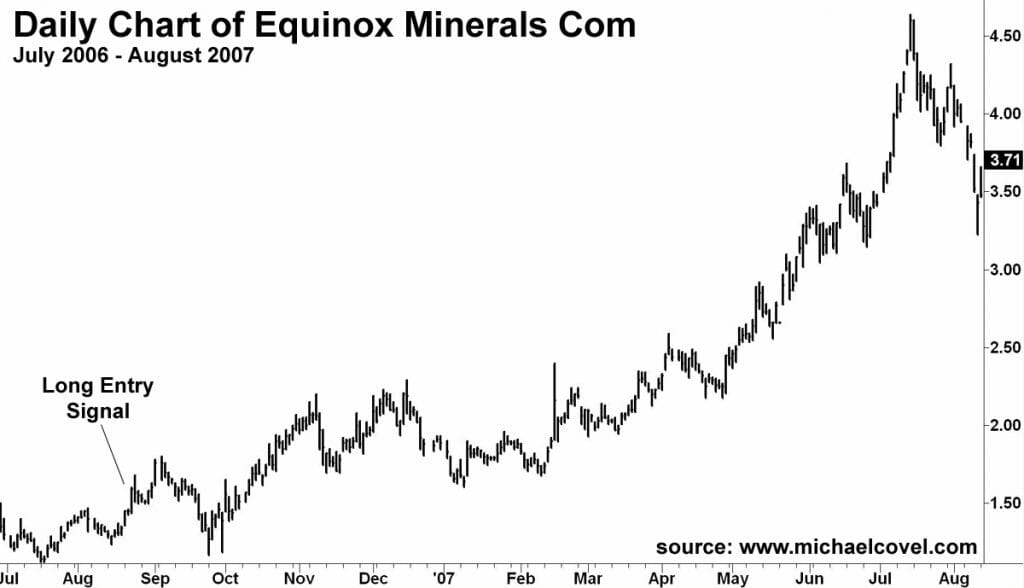
More trend following historical charts:
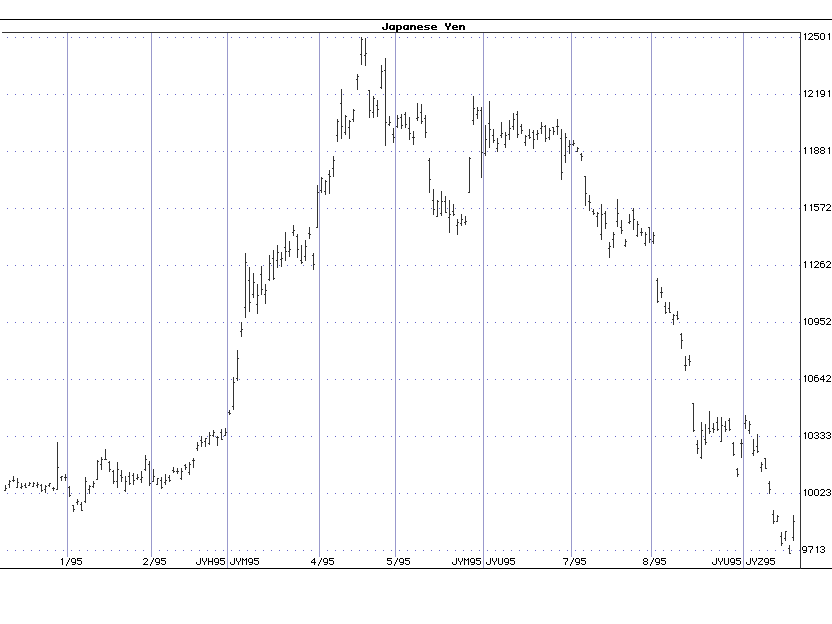


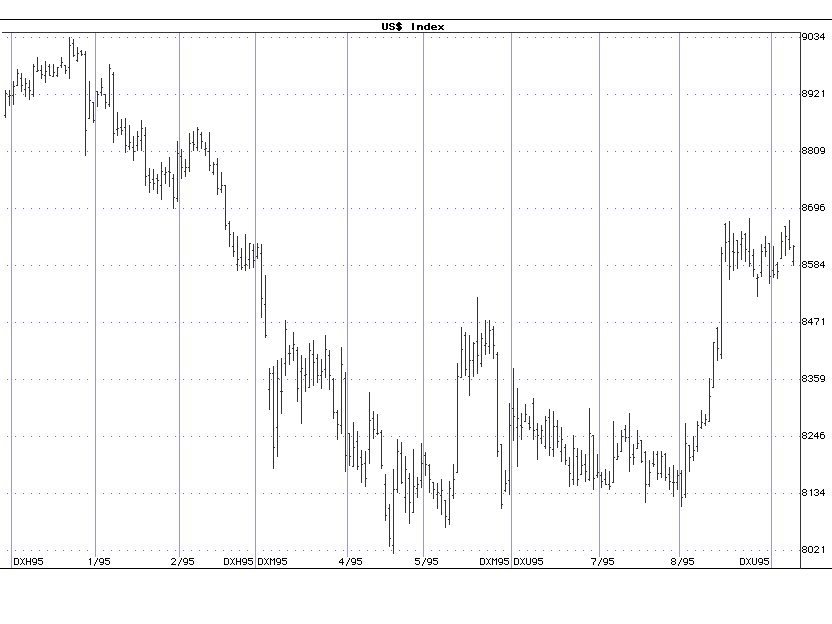

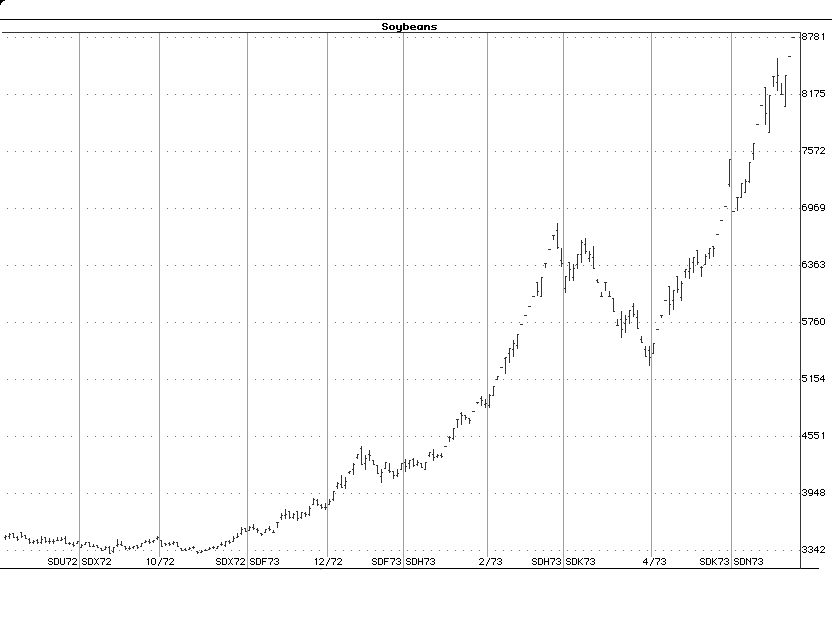
That’s trend following chart overload.
Performance
Trend following performance in action? Read.
Products
Obtain proprietary trend following systems with full support.
Disclaimers
Trend Following™ can not promise you will earn the returns of traders, charts or examples (real or hypothetical) stated. All past performance is not necessarily an indication of future results. Data presented is for educational purposes. Trend Following™ products are provided for informational purposes only and should not be construed as personalized investment advice. All data on this site is direct from the CFTC, SEC, Yahoo Finance, Google and disclosure documents by managers mentioned herein. Trend Following™ assumes all data to be accurate, but assumes no responsibility for errors, omissions or clerical errors made by sources.
Trend Following™ testimonials are the words of real clients received in real correspondence that have not been paid for their testimonials. Testimonials are sometimes printed under aliases to protect privacy, and edited for length. Claims have not been independently verified or audited for accuracy. We do not know how much money was risked, what portion of their total portfolio was allocated, or their exact positions. We do not claim that the results experienced by such clients are typical and you will likely have different results.
Trend Following™ is not registered as a securities broker-dealer or an investment adviser. This information is not designed to be used as an invitation for investment with any adviser profiled. No information herein is intended as securities brokerage, investment, tax, accounting or legal advice, as an offer or solicitation of an offer to sell or buy, or as an endorsement, recommendation or sponsorship of any company, security or fund.
Further, Trend Following™ cannot and does not assess, verify or guarantee the adequacy, accuracy or completeness of any information, the suitability or profitability of any particular investment, or the potential value of any investment or informational source. The reader bears responsibility for his/her own investment research and decisions, should seek the advice of a qualified securities professional before making any investment, and investigate and fully understand any and all risks before investing.
Additionally, Trend Following™ in no way warrants the solvency, financial condition, or investment advisability of any security or instrument. In addition, Trend Following™ accepts no liability whatsoever for any direct or consequential loss arising from any use of this information. This information is not intended to be used as a basis of any investment decision, nor should it be construed as advice designed to meet the investment needs of any particular investor.
HYPOTHETICAL OR SIMULATED PERFORMANCE RESULTS HAVE CERTAIN LIMITATIONS. UNLIKE AN ACTUAL PERFORMANCE RECORD, SIMULATED RESULTS DO NOT REPRESENT ACTUAL TRADING. ALSO, SINCE THE TRADES HAVE NOT BEEN EXECUTED, THE RESULTS MAY HAVE UNDER-OR-OVER COMPENSATED FOR THE IMPACT, IF ANY, OF CERTAIN MARKET FACTORS, SUCH AS LACK OF LIQUIDITY. SIMULATED TRADING PROGRAMS IN GENERAL ARE ALSO SUBJECT TO THE FACT THAT THEY ARE DESIGNED WITH THE BENEFIT OF HINDSIGHT. NO REPRESENTATION IS BEING MADE THAT ANY ACCOUNT WILL OR IS LIKELY TO ACHIEVE PROFIT OR LOSSES SIMILAR TO THOSE SHOWN.