“If there was a strategy that I would want to employ right now, if someone put a gun to my head, I’d say simple trend following strategies. They are not too popular today… They will probably do very well in the next 5 to 10 years.”
–Paul Tudor Jones, Market Wizard, May 3, 2022
A first step for trend following success is to absorb prior trend following success. That breeds confidence. The data assembled on this page (and in my books) demonstrates what is possible with trend following–historically speaking. Consider two pieces of research that outline trend trading success going back over 200 years:
A Century of Evidence on Trend-Following Investing (PDF)
Two Centuries of Trend Following (PDF)
A further great example of success is Bill Dunn. He is one of the greatest trend followers ever. First ballot Hall of Fame. The firm he started has been successfully trading as a trend follower for massive money since 1974. The Dunn Capital continuous track record has never been featured on CNBC, Bloomberg, WSJ, etc. Their track record could easily serve as a PhD-level trend following class. Consider their performance:

Another track record on file with the government from Paul Mulvaney’s Mulvaney Capital:
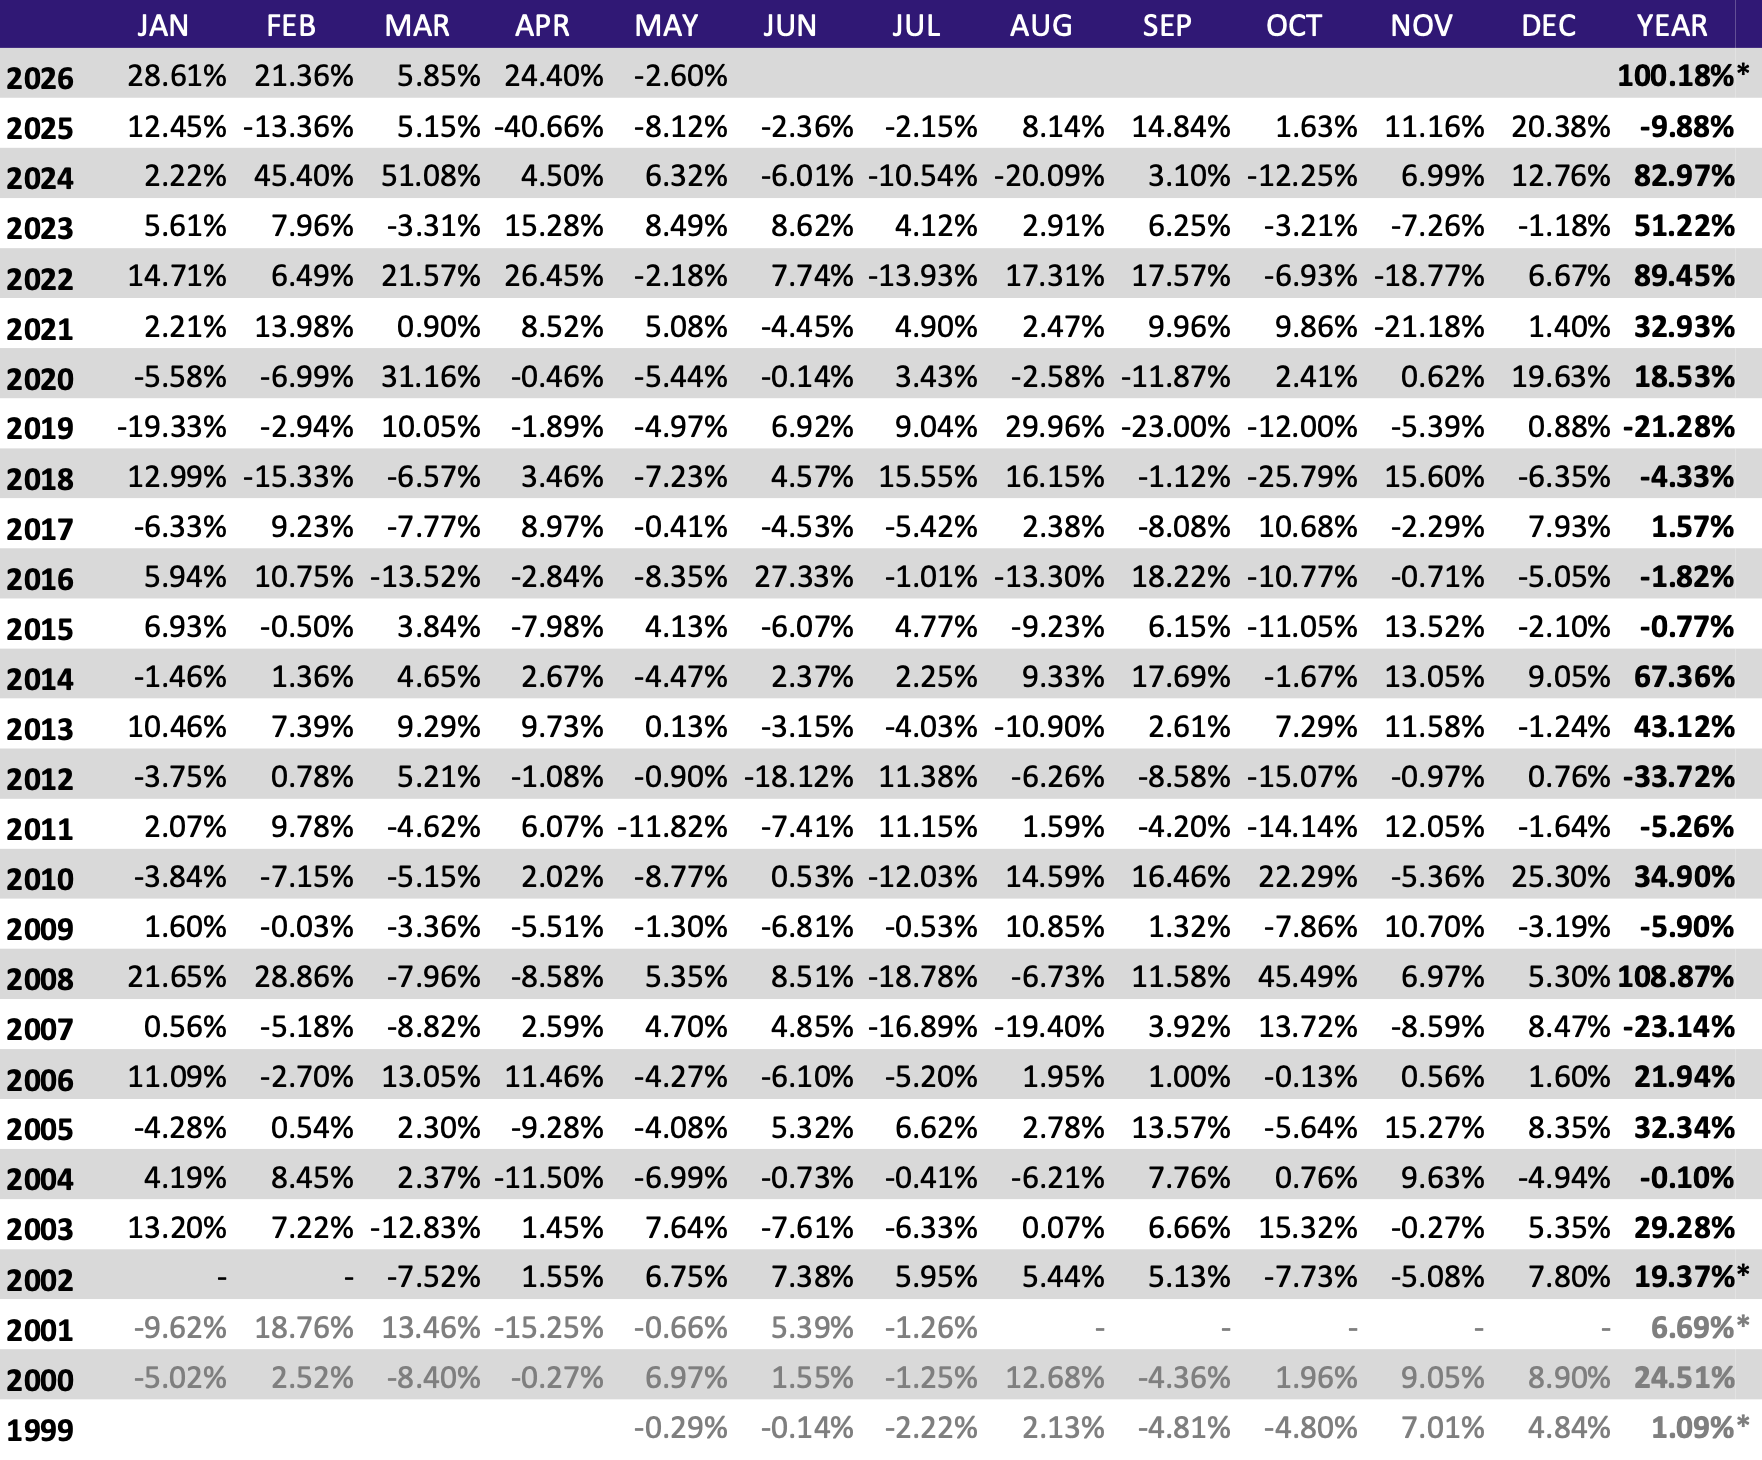
Paul is featured in my Little Book of Trading. His and Dunn’s track record are inspirational. If you want to be a trend follower, if you want the foundation to have a chance at the big money, you can start a proven trend following education immediately.
No one can promise that you will become the next Dunn or Mulvaney or produce those returns. While I am not an agent for either, their performance is on file with the U.S. government. It is proof that classic long term trend following can win big time.
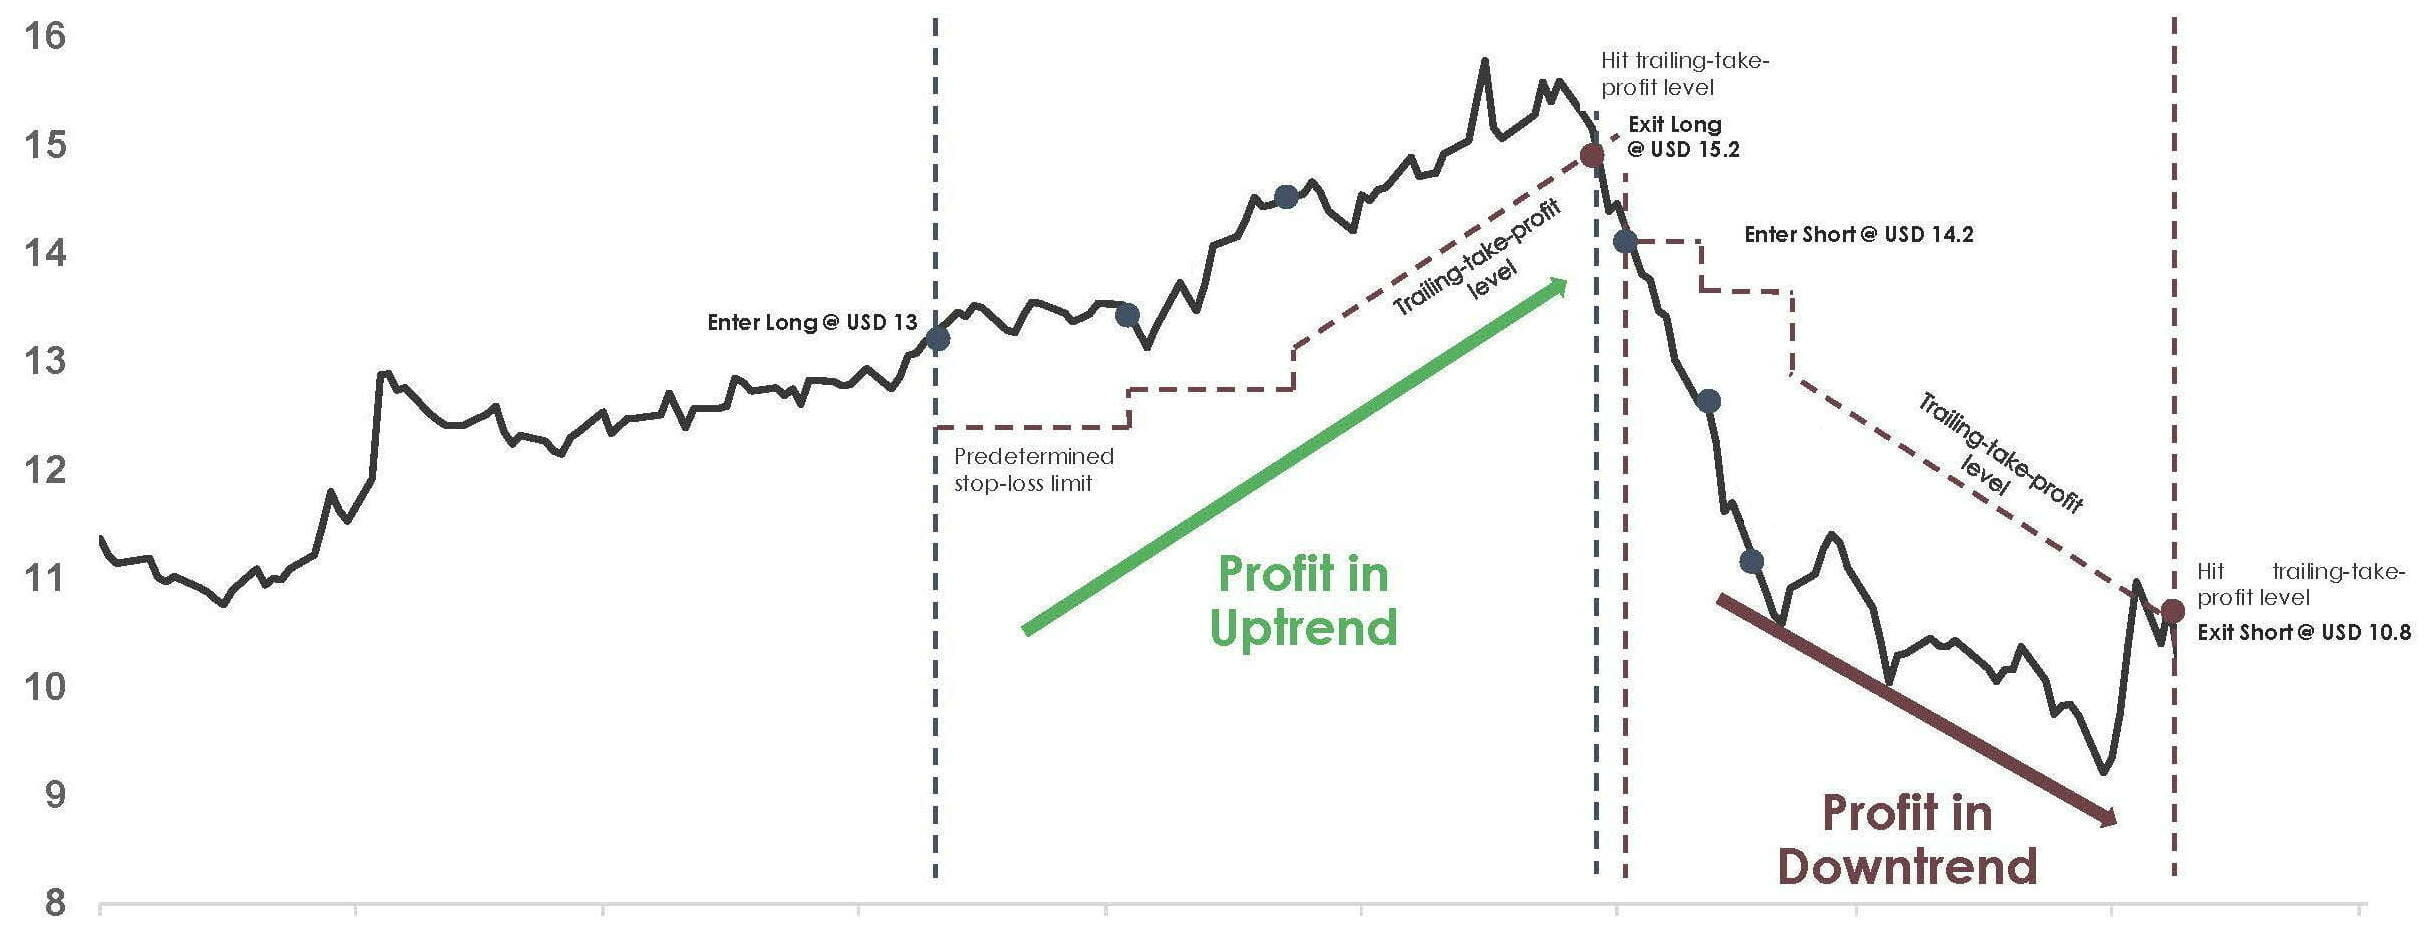
Typical trend following example #1:
Typical trend following example #2:
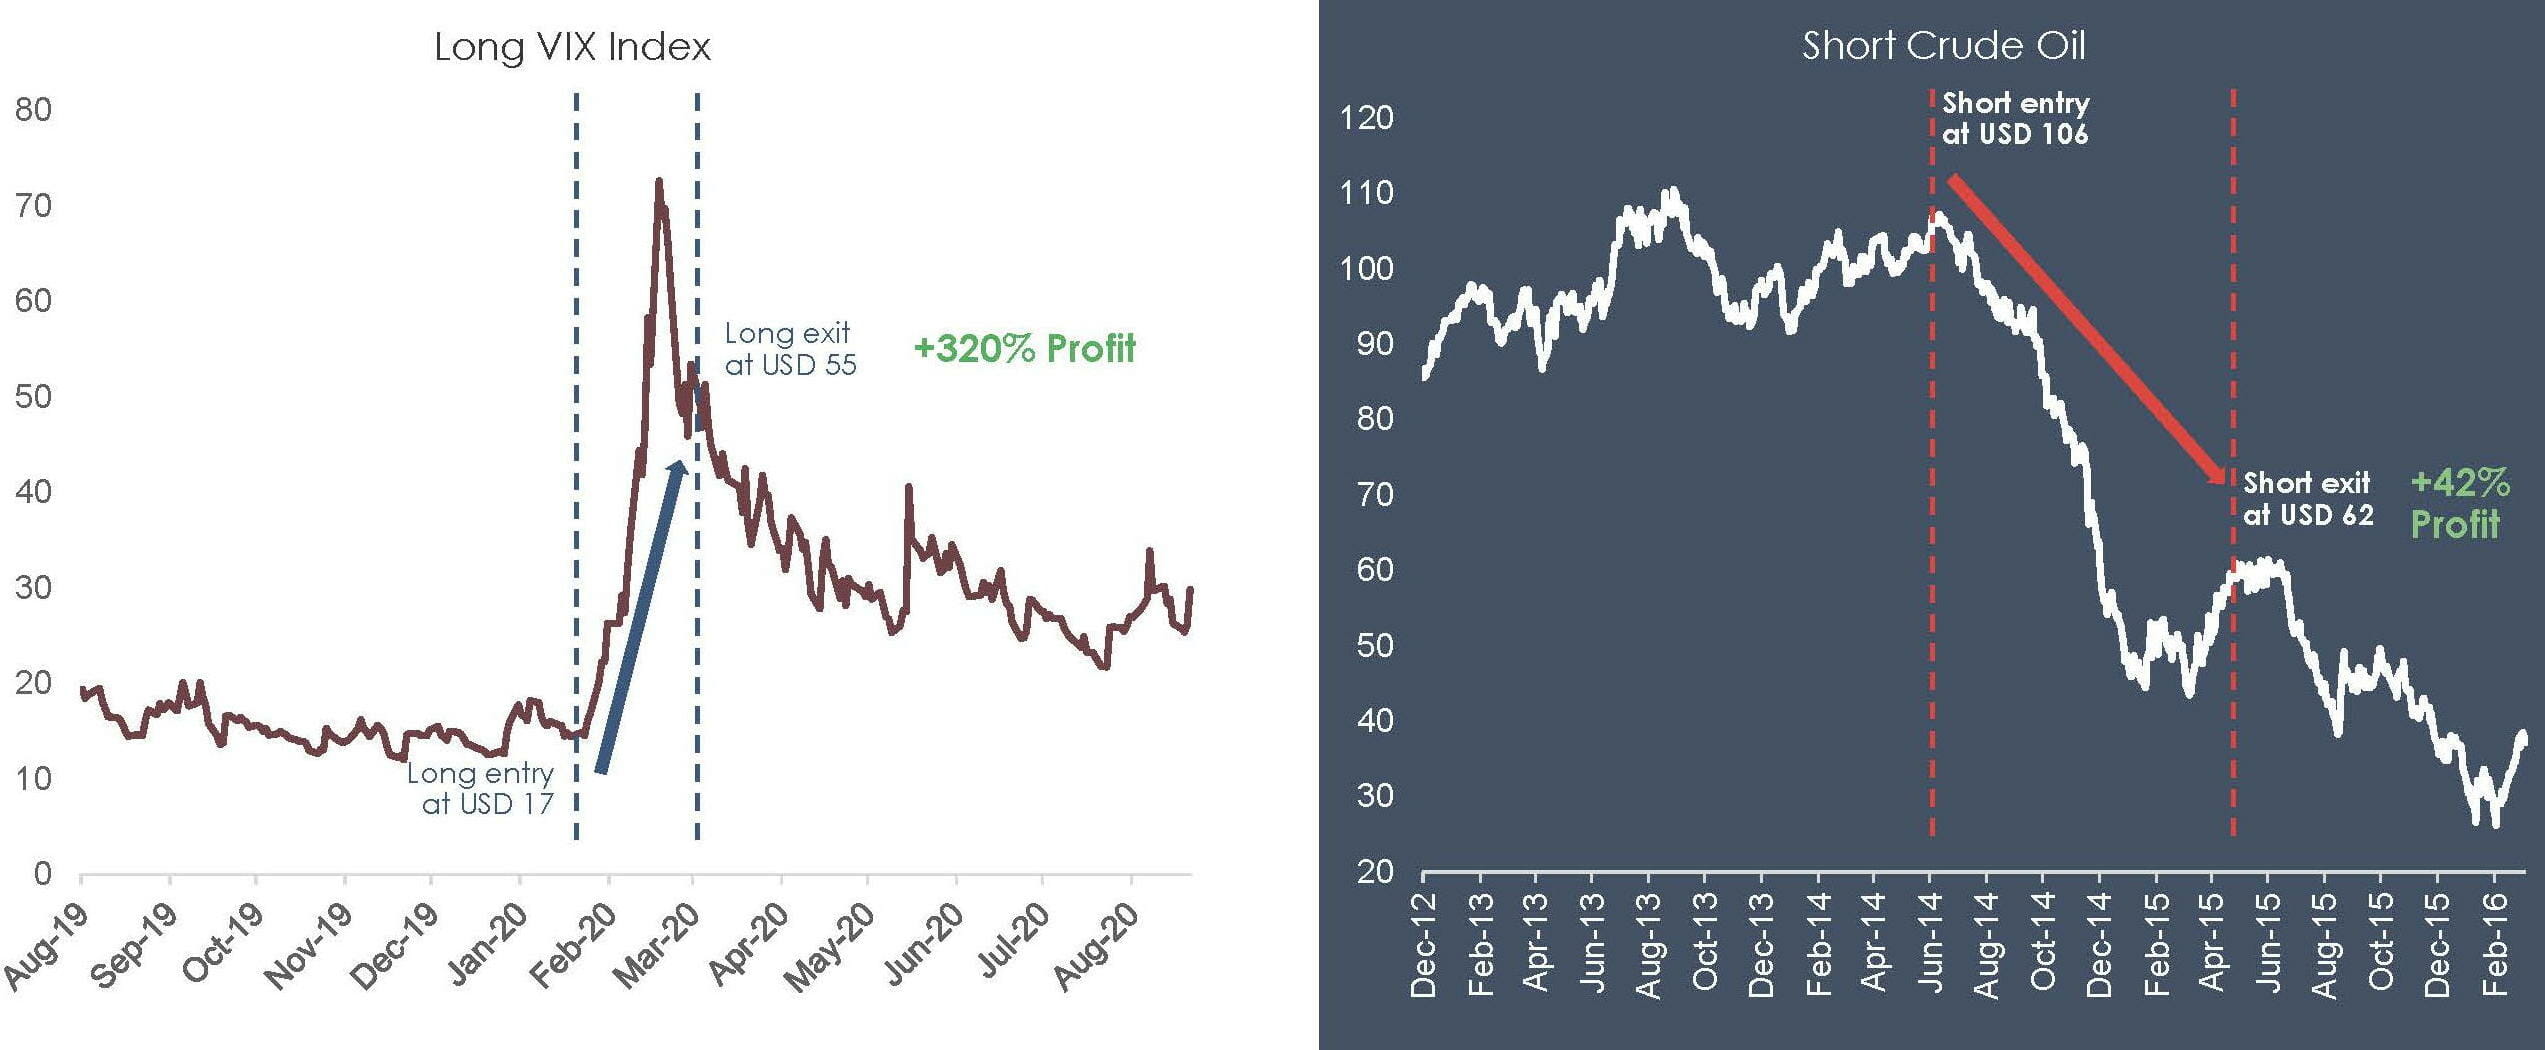
Trend following strategy performs above average when market bubbles pop, when the Black Swan arrives. For example, trend following made huge money during the Stock Crash (1973–74), Black Monday (1987), Barings Bank (1995), LTCM & Asian Crisis (1998), Stock Crash (2000-02), 9/11 (2001), Great Recession (2008-09), Oil Market (2014-16), Brexit (2016), Covid-19 (March, 2020) and 2022-6. More big events.
Review trend following solutions.
Winning Charts
Trend following technology captures greed, fear and basic human nature in big trends up and down. That’s life. That’s how to think and how to profit. Some rip roaring trend following charts in 2026:


Want to see more trend following market charts in action? Read.
Great Trend Followers
In the film Contact, Jodie Foster plays a character called Ellie, a scientist who cannot figure out an alien signal from the deep reaches of outer space until she finds the key—the “primer.” Finally she receives help from a Carl Sagan-like benefactor named S. R. Hadden:
Hadden: The powers that be have been very busy lately, falling over each other to position themselves for the game of the millennium to decipher the alien signal. Maybe I can help deal you back in.
Ellie: I didn’t realize that I was out.
Hadden: Oh, maybe not out, but certainly being handed your hat. I have had a long time to make enemies Doctor…and I wish to make a small contribution. A final gesture of goodwill to the people of this planet…
Ellie: You’ve found the primer!
Hadden: Clever girl.
Today, John W. Henry is the owner of the Boston Red Sox baseball team. He also owns the famed Liverpool Football Club in Britain. How did he make his fortune? Trading in a very rigid, rules-defined way. Like Hadden he had a primer.
Consider:
John W. Henry: Henry is a trend following trader featured in Trend Following. He is worth $2.1 billion (source). He used his trend following gains to buy the Boston Red Sox for $700 million.
Bruce Kovner: Kovner is a trend following trader featured in Jack Schwager’s ‘Market Wizards.’ He was trained by trend follower Michael Marcus. Marcus was trained by Ed Seykota. More on Seykota can be found in Trend Following. Kovner is worth over $5.3 billion (source).
Bill Dunn: Dunn is a trend following trader featured in Trend Following. Dunn made $80 million in 2008 when the rest of the world was blowing up.
Michael Marcus: Marcus is a trend following trader featured in Jack Schwager’s Market Wizards. He turned an initial $30,000 into $80 million (source).
David Harding: Harding is a trend following trader featured in Trend Following. He is worth over $1.387 billion (source).
Ed Seykota: Seykota is a trend following trader featured in Trend Following. He turned $5,000 into $15 million over 12 years in his model account (an actual client account).
Kenneth Tropin: Tropin is a trend follower who made $120 million in 2008 as buy and hold collapsed. Earlier in his career he led John W. Henry’s firm.
Those trend followers all started as one-man shops and that is inspirational.
Disclaimers
Trend Following™ can not promise you will earn the returns of traders, charts or examples (real or hypothetical) stated. All past performance is not necessarily an indication of future results. Data presented is for educational purposes. Trend Following™ products are provided for informational purposes only and should not be construed as personalized investment advice. All data on this site is direct from the CFTC, SEC, Yahoo Finance, Google and disclosure documents by managers mentioned herein. Trend Following™ assumes all data to be accurate, but assumes no responsibility for errors, omissions or clerical errors made by sources.
Trend Following™ testimonials are the words of real clients received in real correspondence that have not been paid for their testimonials. Testimonials are sometimes printed under aliases to protect privacy, and edited for length. Claims have not been independently verified or audited for accuracy. We do not know how much money was risked, what portion of their total portfolio was allocated, or their exact positions. We do not claim that the results experienced by such clients are typical and you will likely have different results.
Trend Following™ is not registered as a securities broker-dealer or an investment adviser. This information is not designed to be used as an invitation for investment with any adviser profiled. No information herein is intended as securities brokerage, investment, tax, accounting or legal advice, as an offer or solicitation of an offer to sell or buy, or as an endorsement, recommendation or sponsorship of any company, security or fund.
Further, Trend Following™ cannot and does not assess, verify or guarantee the adequacy, accuracy or completeness of any information, the suitability or profitability of any particular investment, or the potential value of any investment or informational source. The reader bears responsibility for his/her own investment research and decisions, should seek the advice of a qualified securities professional before making any investment, and investigate and fully understand any and all risks before investing.
Additionally, Trend Following™ in no way warrants the solvency, financial condition, or investment advisability of any security or instrument. In addition, Trend Following™ accepts no liability whatsoever for any direct or consequential loss arising from any use of this information. This information is not intended to be used as a basis of any investment decision, nor should it be construed as advice designed to meet the investment needs of any particular investor.
HYPOTHETICAL OR SIMULATED PERFORMANCE RESULTS HAVE CERTAIN LIMITATIONS. UNLIKE AN ACTUAL PERFORMANCE RECORD, SIMULATED RESULTS DO NOT REPRESENT ACTUAL TRADING. ALSO, SINCE THE TRADES HAVE NOT BEEN EXECUTED, THE RESULTS MAY HAVE UNDER-OR-OVER COMPENSATED FOR THE IMPACT, IF ANY, OF CERTAIN MARKET FACTORS, SUCH AS LACK OF LIQUIDITY. SIMULATED TRADING PROGRAMS IN GENERAL ARE ALSO SUBJECT TO THE FACT THAT THEY ARE DESIGNED WITH THE BENEFIT OF HINDSIGHT. NO REPRESENTATION IS BEING MADE THAT ANY ACCOUNT WILL OR IS LIKELY TO ACHIEVE PROFIT OR LOSSES SIMILAR TO THOSE SHOWN.